How did secondary schools do in 2017?
16th October 2017 by Timo Hannay [link]
Up-grade
Last Thursday, the DfE release provisional secondary school performance data for 2017 along with destinations data for 2016. Following our regular website update at the weekend, these are now available on SchoolDash Maps and Explorer. This post takes an initial look at the new data.
The biggest underlying change is that English and Maths have adopted the new grading system, which goes from 9 (best) to 1 (worst) instead of A* to G. This is designed to be more discerning towards the top end, with 9 a bit better than an A* and the previous pass level of grade C now split into two: grade 4 (standard pass) and grade 5 (strong pass). Most other GCSE subjects will adopt this new system from 2018 onwards.
New data, same story
As you can see in Maps 1 and 2, the proportions of pupils with a standard pass (left-hand map) or a strong pass (right-hand map) in English and Maths continue to show clear regional patterns, with London and the South East doing best while the Midlands and the North do less well.
Maps 1 and 2: Percentage of pupils gaining standard / strong passes in both English and Maths (2017)

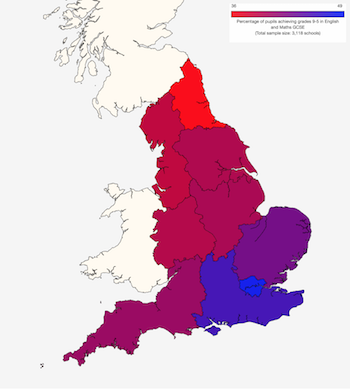
(Click on these or any of the maps below to be taken to a larger, interactive version.)
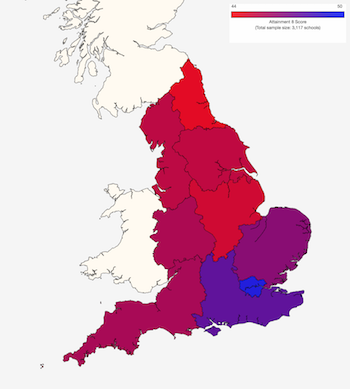
There is a similar pattern when we look at the traditional measure of 'five good GCSEs' (which now corresponds to English and Maths at grades 9-4 along with three other subjects at grades A*-C). This is shown in Map 3 (below left). Regular followers of SchoolDash will know that this north-south divide is not a new phenomenon. The Attainment 8 measure, which provides a more nuanced metric across a wider range of subjects, shows a broadly similar pattern, as shown in Map 4 (below right).
Maps 3 and 4: Average percentage of pupils gaining 5 good GCSEs / average Attainment 8 Score (2017)

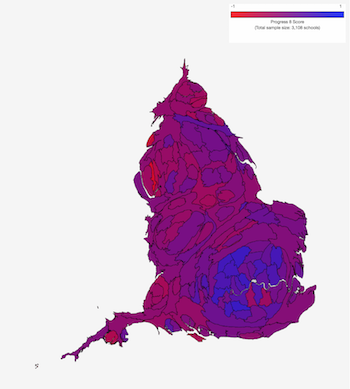
The Progress 8 measure, which takes into account pupils' attainment levels on entering secondary school, show a rather different distribution, though London still comes first and the North East last. However, compared to the absolute attainment measures described above, Yorkshire and The Humber does better and the South West does worse. In this case, the differences are easiest to see by local authority or parliamentary constituency, as shown in Maps 5 and 6, respectively. (Note that these maps have been rescaled based on pupil numbers. This makes small, heavily populated areas easier to see.)
Maps 5 and 6: Average Progress 8 Scores by local authority / parliamentary constituency (2017)

Typecasting
Figure 1 summarises Attainment 8 Scores (vertical axis) and Progress 8 Scores (horizontal axis) by various school types, including region, but also using other categories that we will explore below. The large grey dot in the middle represents all mainstream state secondary schools in England, so serves as a reference point. (Dot sizes indicate numbers of pupils. Hover your mouse over a dot to see the accompanying data.)
Categorising schools by Ofsted rating shows a clear trend, with 'Outstanding' schools showing both much higher attainment and much more progress than 'Inadequate' schools. Grammar schools showed not only much higher attainment (as you might expect) but also greater progress than the national average. Many grammar schools are single-sex and, sure enough, single-sex schools (especially girls' schools) did better than mixed-sex schools (something we've looked into before). Also related to this, schools that have small proportions of pupils with low prior attainment showed not only higher levels of GCSE attainment (obviously), but also greater pupil progress – yet another example of the Matthew Effect in education.
Figure 1: Average Attainment 8 and Progress 8 Scores by school type (2017)
Looking at other categories, socioeconomic deprivation within the school made a difference to both attainment and progress, but the effects of local deprivation around the school were more modest. Large schools did better than small ones and faith schools did better than non-faith schools. Among academies, converters (typically schools that were high-performing before they became academies) did best and free schools (newly established academies) did worst, particularly in terms of progress – though bear in mind that most are very new and they represent a small proportion of all pupils. (Use the legend above Figure 1 to turn individual categories on or off in order to explore them yourself.)
Where to?
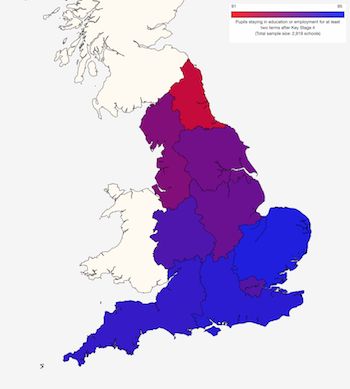
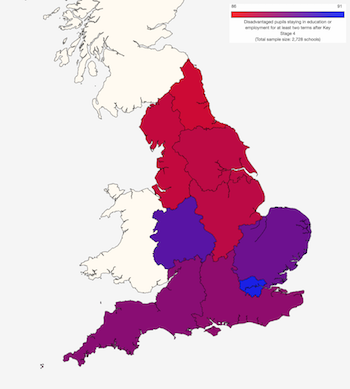
Finally, we can take a quick look at pupil destinations after leaving secondary school. Map 7 (below left) shows the proportions staying in education or going into employment, which are above 90% in all regions (though there bigger variations by local authority area or parliamentary constituency). Again, there is a clear north-south difference. Although London does much less well on this measure, it does appear unusually good at getting disadvantaged pupils into education or employment, as shown in Map 8 (below right).
Maps 7 and 8: Percentage of all pupils / disadvantaged pupils going into education or employment (2017)
In highlighting these national trends, it's important to emphasise that the differences within regions (and other groups) are invariably greater than those between them. Geography is not destiny – far from it. But it's also hard to escape the fact that we remain a starkly divided country, educationally as well as in other ways.
SEEdash: A new view of education
12th October 2017 by Timo Hannay [link]
Come and SEE
We're delighted to announce the launch of SEEdash, the result of a longstanding collaboration between SchoolDash, the Institute of Physics, the Royal Academy of Engineering and the Gatsby Foundation.
The "SEE" in SEEdash is short for Science and Engineering in Education, but in fact the service covers essentially all subjects and qualifications for 15-19 year olds in England. The aim is to provide a quick and easy way to interrogate DfE exam entry and results data by qualification, subject, school type, pupil type and geography. It won't answer every question, but we hope that it will increase transparency, help to inform debates and avoid duplication of effort among analysts.
SEEdash also makes it easy to share the charts you create, whether through other websites, in presentations or in written documents. You can also download any data you generate for further analysis offline. For more details, see the instructions included on the site.
To give you an idea of what's possible, the figures that follow show examples of the sorts of charts that SEEdash can help you to create.
Here are some we made earlier
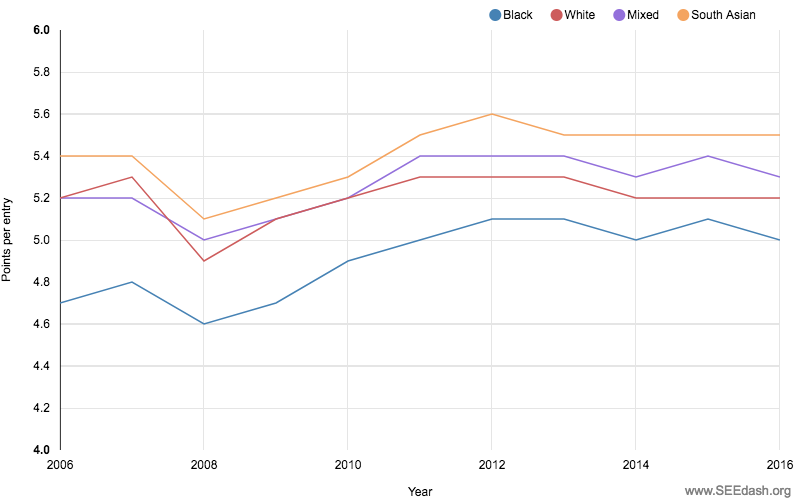
Ethnic inequality is much in the news right now (and something we've previously analysed in depth). It's also a topic we can investigate using SEEdash. For example, Figure 1, below, shows that average GCSE attainment does indeed vary by ethnicity, with South Asian pupils performing best and Black pupils worst, and that these gaps have persisted for at least a decade. (Broadly similar trends apply at A-level too.)
Figure 1: Average GCSE attainment points per entry for different ethnic groups
(Click on the figure above, or any of the following figures, to go to an interactive, editable version on SEEdash.)
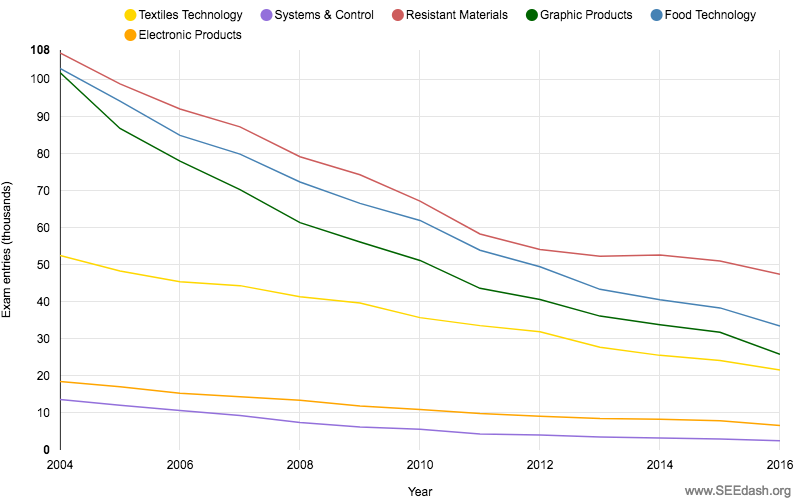
Another recent news story concerns declining entries in design-related subjects. This, too, can be clearly seen in the SEEdash data, as shown in Figure 2.
Figure 2: Numbers of exam entries in GCSE Design and Technology
In contrast, it's interesting to note that GCSE Information Technology, which used to show a similar decline, has recently been heading in the opposite direction.
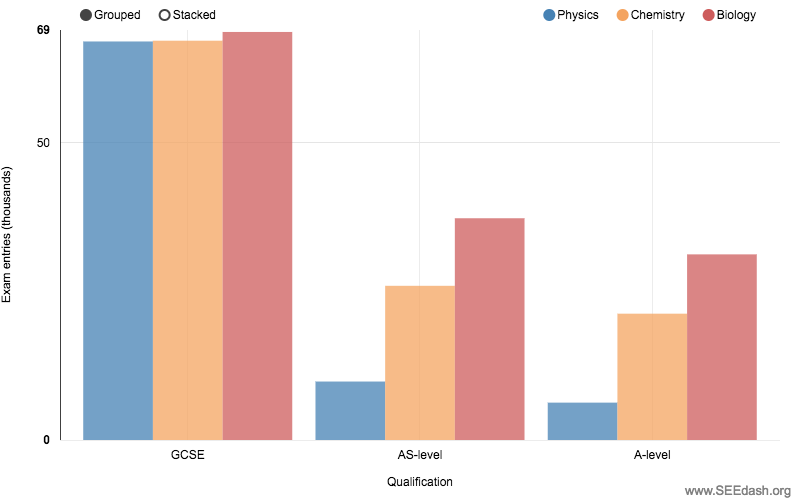
Another perennial theme in education is the dearth of girls taking A-level Physics. Once again, we can examine this effect using SEEdash data, as shown in Figure 3.
Figure 3: Numbers of exam entries among girls (2016)
At GCSE, Biology, Chemistry and Physics are all roughly equally popular among girls. But at A-level there are huge differences in uptake, with Physics showing only about a fifth the level of Biology, and Chemistry coming somewhere in between. (If anything, boys show the opposite trend.)
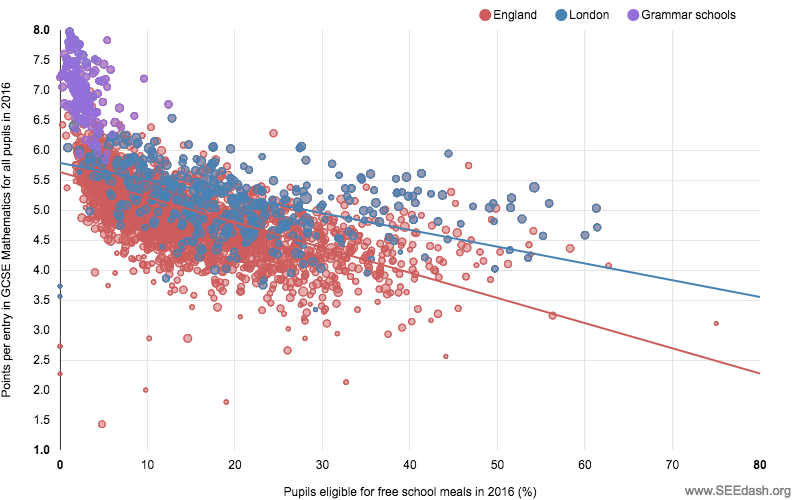
It's also well known that poverty is associated with lower academic attainment. To illustrate this, Figure 4 shows the relationship between GCSE Maths attainment and the proportion of pupils who are eligible for free school meals. (Maths is a good subject to use because most pupils take the exam; other subjects are more prone to pupil selection bias.) Each dot represents a secondary school. The blue dots are those in London while the purple dots are grammar schools.
Figure 4: GCSE Maths attainment and proportion of pupils eligible for free school meals (2016)
As you can see, there is a fairly clear overall negative trend (red regression line), but also a lot of variation caused by other factors. In addition, London schools (in blue) seem to have collectively reduced the effects of poverty – a sign of their marked and much-discussed improvement over the last 15 years. Grammar schools (in purple) show both very low proportions of poor pupils and – even allowing for this – very high levels of attainment, illustrating why they are both loved and loathed, depending on your educational priorities.
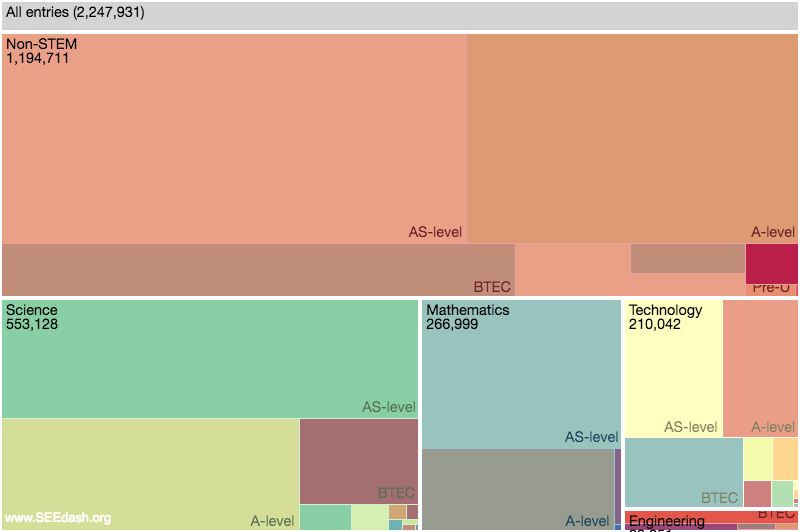
Figure 5, below, shows the proportions of exam entries at sixth forms and FE colleges, broken down by subject category. It demonstrates that, despite recent increases in STEM subject entries (compare the proportions in 2006), non-STEM subjects remain more popular in aggregate. On top of this, Science subjects dominate in STEM while Engineering makes up only a tiny proportion, even in further education.
Figure 5: Numbers of exam entries in 16-18 education by subject category (2016)
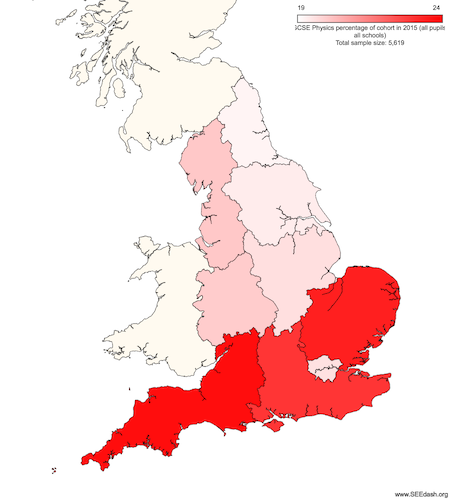
There are interesting geographical trends in subject adoption, too. For example, Figure 6 shows that GCSE Physics is more popular in the South (outside London) than in the North. (Biology and Chemistry show very similar patterns.)
Figure 6: Percentage of cohort taking GCSE Physics (2016)
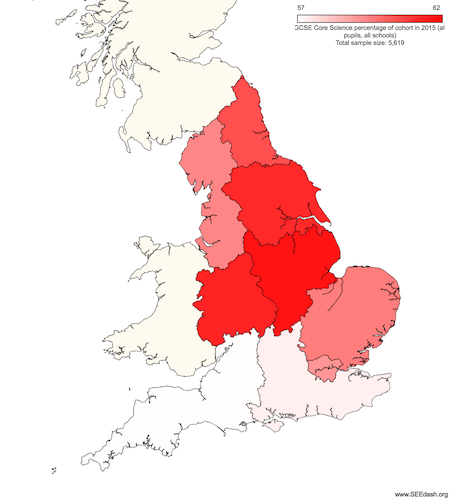
In contrast, Core Science shows roughly the opposite trend, as shown in Figure 7.
Figure 7: Percentage of cohort taking GCSE Core Science (2016)
Do try this at home
We could go on, but you get the idea so it's time to have a go yourself. Do let us know what you think by writing to [email protected]. And if you create something especially interesting then please share it with us so we can include it in the SEEdash Gallery for others to learn from and admire.