Do grammar schools work for everyone?
2nd December 2016 by Timo Hannay [link]
The big picture
Following decades of decline and containment, selective state schools – aka grammar schools – look set to make a comeback. As part of a wide-ranging educational reprioritisation outlined in their recent consultation document, the new Conservative government led by Theresa May is proposing to allow existing grammar schools to expand and new ones to open. Predictably, this has delighted some and outraged others.
As usual, SchoolDash takes a close interest in this debate without taking sides. With the aim of informing the discussion ahead of the government's deadline for responses on 12th December, we decided to look at what the available data say about the effects of grammar schools, not just on the kids who attend them but on the education system as a whole1.
Here's a summary of our main findings:
- Prevalence: There are 163 grammar schools in England located in 36 local authority (LA) areas, where they account for between 1.8% and 44% of the secondary school population. In the 10 LAs generally recognised as being fully selective, they account for 26-44% of secondary pupils.
- Private schools: The presence of grammar schools correlates with much lower proportions of pupils going to private schools. In areas with grammar schools, 8% of all secondary school children attend a private school, while in otherwise similar non-selective areas the proportion is 13%.
- Poor pupils: All grammar schools contain relatively low proportions of poor pupils, but the biggest discrepancies are seen in partially selective areas (ie, those with smaller numbers of grammar schools), presumably because competition for places is fiercest there. White British pupils are also slightly under-represented at grammar schools, but more so in some areas than in others.
- Nearby schools: Non-selective schools that are close to grammar schools tend to have fewer pupils with high prior attainment and more pupils with low prior attainment than those that do not have a grammar school nearby. The closer the grammar school the larger this effect. Consistent with this trend, non-selective schools in non-selective areas outperform those in selective areas.
- Non-grammar pupils: The GCSE performance of low- and medium-ability pupils (ie, those who would not normally attend a grammar school even if one was available) is slightly worse in fully selective areas than among otherwise similar schools in non-selective areas, though the size of this effect varies by subject. Moreover, non-selective schools in selective areas show lower entry rates for certain subjects (eg, Biology, Chemistry and Physics) and higher entry rates for others (eg, Core Science).
- Progression to post-16 education: At age 16, there are slightly higher progression rates from Key Stage 4 to Key Stage 5 in selective local authorities compared to otherwise similar non-selective local authorities. Moreover, selective areas show much higher rates of progression to sixth forms (which tend to be more academic) and correspondingly lower rates of progression to further education colleges (which are usually more vocational).
- Progression to higher education: Selective areas also show higher rates of progression from state schools to the most selective universities, such as those in the Russell Group and Oxbridge. This is in part because of their lower populations of private school pupils, but even when when this is taken into account a difference remains.
The wheres and the whys
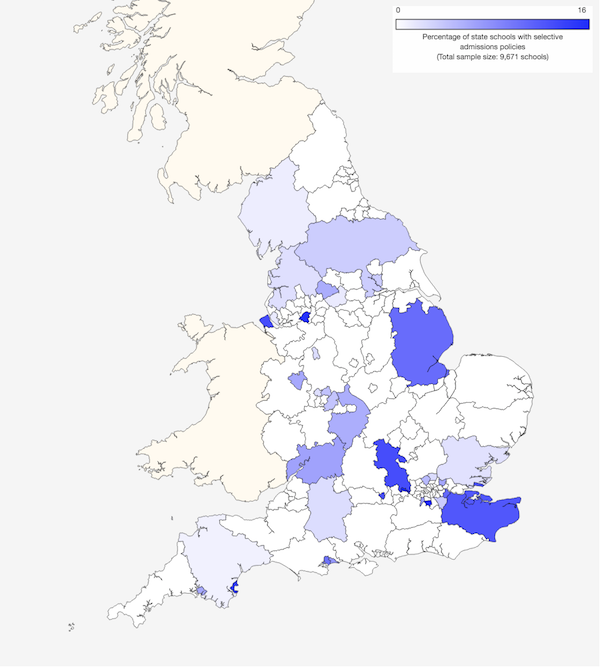
The current grammar school system in England originated in the 1940s with the introduction of the country's first nationwide state-funded secondary school system. Pupils were divided up at age 11 between grammar schools, which were highly academic, and secondary modern schools, where they were expected to pursue more vocational paths. During the 1970s and 1980s this system, which became seen by many as class-ridden and divisive, was gradually dismantled and most grammar schools either converted into comprehensive schools, became independent (ie, started charging fees) or closed down. However, some remained, mostly clustered in particular parts of the country (see Map 1 below).
For the last 35 years or so, the remaining grammar schools have existed in state of suspended animation, being neither required to change their admissions policies nor permitted to expand or multiply. This reflects the deeply ambivalent way in which they are perceived, with some holding them up as bastions of excellence and egalitarianism and others decrying them as anachronistic perpetuators of middle-class privilege and social division. Surveys (such as these two from YouGov) indicate that the majority of parents support the existence of grammar schools. On the other hand, most educationalists and social scientists are opposed to them, usually on the grounds that they increase social inequality (see for example this paper from the Education Policy Institute and this one from the Institute of Education).
There are currently 163 grammar schools in England2. As shown in Map 1, they are particularly prevalent in certain local authority areas such as Torbay, Kent, Sutton, Medway, Bexley, Southend-on-Sea, Slough, Buckinghamshire, Lincolnshire, Wirral and Trafford. (Click on the map to go to a larger interactive version.)
Map 1: Proportion of secondary schools that are grammar schools (2016)
Map 2 also shows the locations of grammar schools across England, but presented as a 'heatmap', which shows their density in different parts of the country. Of the 163 grammar schools of all types, 60 (37%) of them are girls-only, 57 (35%) are boys-only and a mere 46 (28%) are mixed sex. Note that the latter group have a very different distribution to single-sex grammar schools, which are often located close together in boy-girl pairs. (Use the buttons on the top-left of the map to change the view, and those at the bottom-right to zoom in or out; drag the map to pan around.)
Map 2: Grammar school density (2016)
Table 1, below, shows pupil statistics for all local authorities (LAs) that have at least one grammar school – click on the link provided to display or hide the data. The ten LAs that are generally considered to be fully selective are shown in italics. (Curiously, these do not include Wirral or Poole, both of which have more than 25% of secondary school pupils in grammar schools, but their omission from the top 10 list doesn't materially affect any of the results presented below.)
| Local authority | Secondary school pupils (2016) | Proportion in grammar schools (%) |
| Trafford | 16890 | 44.3 |
| Buckinghamshire | 42480 | 36.3 |
| Slough | 11020 | 35.8 |
| Southend-on-Sea | 13190 | 33.3 |
| Torbay | 8950 | 32.8 |
| Medway | 19550 | 30.5 |
| Kent | 112785 | 29.6 |
| Sutton | 18915 | 29.5 |
| Wirral | 22060 | 29.5 |
| Bexley | 20315 | 27.1 |
| Lincolnshire | 49110 | 26.3 |
| Poole | 9460 | 25.7 |
| Bournemouth | 11150 | 20.2 |
| Reading | 9455 | 17.2 |
| Kingston upon Thames | 13010 | 16 |
| Plymouth | 17585 | 15.9 |
| Gloucestershire | 43980 | 14.2 |
| Calderdale | 16395 | 13.4 |
| Telford and Wrekin | 11320 | 11.8 |
| Warwickshire | 37540 | 10.9 |
| Barnet | 27020 | 9.9 |
| Birmingham | 78375 | 9.6 |
| Stoke-on-Trent | 12445 | 8.8 |
| Bromley | 25455 | 7.9 |
| Redbridge | 25390 | 7.2 |
| Walsall | 21195 | 7.2 |
| Lancashire | 70205 | 6.2 |
| Enfield | 23210 | 5.9 |
| North Yorkshire | 42720 | 5.7 |
| Wiltshire | 34210 | 5.7 |
| Kirklees | 26340 | 5.3 |
| Wolverhampton | 16645 | 4.7 |
| Essex | 91165 | 3.8 |
| Liverpool | 29805 | 3.4 |
| Cumbria | 31820 | 2.6 |
| Devon | 44725 | 1.8 |
A natural experiment
The uneven geographical distribution of grammar schools provides an interesting opportunity to conduct a natural experiment. Providing we can adequately control for other potentially confounding factors, comparisons of areas that have retained grammar schools with those that have not should allow us to test the effects these schools have on various educational activities and outcomes. To that end, we matched each selective LA with the non-selective LA that most closely resembles it in terms of:
- Size of secondary school pupil population
- Level of economic deprivation
- Proportion of white British pupils
- Proportion of pupils with English as a first language
- Degree of urbanisation
- Prior attainment at the end of Key Stage 2 (ie, at age 11)
In addition, we only matched selective LAs in London with non-selective LAs that are also in London, and similarly for those outside London. This is because London differs from the rest of the country in many of its educational characteristics and we didn't want those to be a source of potential variation between the two groups. Table 2, below, shows each selective LA and its corresponding similar non-selective LA. (Again, click on the link provided to show or hide the table contents.)
| Selective local authority | Similar non-selective local authority (non-unique matching) | Similar non-selective local authority (unique matching) |
| Barnet | Hounslow | Hounslow |
| Bexley | Havering | Havering |
| Birmingham | Manchester | Manchester |
| Bournemouth | York | York |
| Bromley | Havering | Hillingdon |
| Buckinghamshire | Hampshire | Hampshire |
| Calderdale | Stockport | Stockport |
| Cumbria | Durham | Durham |
| Devon | Dorset | Dorset |
| Enfield | Southwark | Southwark |
| Essex | Northamptonshire | Northamptonshire |
| Gloucestershire | Hampshire | Leicestershire |
| Kent | West Sussex | West Sussex |
| Kingston upon Thames | Richmond upon Thames | Richmond upon Thames |
| Kirklees | Bolton | Bolton |
| Lancashire | Hampshire | Staffordshire |
| Lincolnshire | Leicestershire | Cheshire West and Chester |
| Liverpool | Dudley | Dudley |
| Medway | East Sussex | East Sussex |
| North Yorkshire | Hampshire | Cheshire East |
| Plymouth | South Gloucestershire | South Gloucestershire |
| Poole | Darlington | Darlington |
| Reading | Rutland | Rutland |
| Redbridge | Hounslow | Wandsworth |
| Slough | Rutland | Windsor and Maidenhead |
| Southend-on-Sea | Stockton-on-Tees | Stockton-on-Tees |
| Stoke-on-Trent | Herefordshire | Herefordshire |
| Sutton | Havering | Croydon |
| Telford and Wrekin | Darlington | Redcar and Cleveland |
| Torbay | Darlington | Warrington |
| Trafford | Solihull | Solihull |
| Walsall | Newcastle upon Tyne | Newcastle upon Tyne |
| Warwickshire | Hampshire | Shropshire |
| Wiltshire | Dorset | Somerset |
| Wirral | Wigan | Wigan |
| Wolverhampton | Nottingham | Nottingham |
If we simply pair each selective LA with the most similar non-selective LA then some non-selective LAs appear more than once (shown in the 'non-unique matching' column in Table 2). As a result, the 36 selective LAs were paired with a total of 25 unique non-selective LAs. This makes the matching as close as possible but raises the potential concern that if any of the duplicate LAs are atypical then the results could be skewed by their multiple appearances. To check for this, we also ran the analysis with the additional constraint that each non-selective LA could appear only once (shown in the 'unique matching' column in Table 2). This made very little difference to the results, so the data presented below are all based on non-unique matching.
Figure 1 shows the pupil characteristics of these different groups of LAs. On average, non-selective LAs (dark blue bar) have more pupils who are eligible for free school meals than selective LAs (red bar). They also have slightly fewer pupils with white British ethnicity and English as a first language, and are more urban. The group of similar non-selective LAs (light blue bar) – picked to be as similar as possible to the selective LAs – are indeed more alike, though of course not quite identical, in terms of poverty, ethnicity, language and urbanisation.
Figure 1: Pupil characteristics of selective and non-selective local authority areas (2015)
They are also more similar when it comes to prior attainment: the average Key Stage 2 point score for all non-selective LAs is 27.5 compared to 28.4 for selective LAs, while the similar non-selective LAs have an average score of 27.9. The same is true when it comes to their size. Across all non-selective LAs, the average pupil number is about 21,800. Selective LAs are larger, with an average of 31,300 pupils, while the group of similar non-selective LAs has an average of 28,600 pupils.
Public or private, rich or poor?
With that, we can compare the group of selective LAs with the group of similar non-selective LAs to see if there are any differences in educational activities and outcomes. One of the most noticeable is the discrepancy in private school enrolment, which is shown in Figure 2. Among selective LAs as a whole, 8.1% of secondary school pupils are enrolled at private schools compared with 13.2% of pupils in similar non-selective LAs. This supports the common notion that, at least for more affluent families, grammar schools often act as an alternative to private schools.
Figure 2: Private school enrolment (2015)
There also seems to be some correlation with the amount of grammar school provision. Among the 10 fully selective LAs, only 5.2% of secondary school pupils attend a private school compared to 12.5% in the corresponding group of similar non-selective LAs, so the gap is even greater.
As widely reported in previous analyses, including one conducted by SchoolDash, pupils eligible for free school meals (FSM), an indicator of poverty, are heavily under-represented at grammar schools. Almost all grammar schools have substantially lower proportions of FSM pupils than would be expected if they selected pupils at random from their local communities, even after allowing for the fact that those communities tend to be slightly more affluent than the national average (see Figure 12 in the previous SchoolDash study).
The same effect is shown in a different way in Figure 3, where each dot represents a selective LA. As the proportion of pupils attending grammar schools grows (horizontal axis), the proportion of FSM pupils in those schools grows at a much slower rate (vertical axis). Overall, FSM pupils gain grammar school places at just over one fifth of the rate of the pupil population as a whole. (Hover your mouse over the dots to see details for each LA.)
Figure 3: Proportion of FSM pupils versus proportion of all pupils attending grammar schools (2015)
Furthermore, LAs with small numbers of grammar school places (on the left of the graph) tend to have even lower proportions of FSM pupils than selective LAs as a whole (their dots mostly fall below the trend line) while those with higher numbers of grammar school places (on the right) show slightly less bias against poor children (their dots are often above the line). This is presumably because competition is fiercest in areas with only a few grammar school places, putting poor children there at an even bigger disadvantage. Thus grammar schools heavily disfavour poor children, but increasing their number tends to make this effect weaker.
In a similar vein, Figure 4 shows that white British pupils are also, on average, slightly under-represented in grammar schools, though nowhere near to the degree seen for poor children. Once again the effect varies by area.
Figure 4: Proportion of white British pupils versus proportion of all pupils attending grammar schools (2015)
Keep your distance
Grammar schools naturally have an effect on nearby non-selective schools. One of the most significant of these is illustrated in Figure 5, which shows the proportions of previously high-, medium- and low-attaining pupils at non-selective secondary schools as a function of their distance from the nearest grammar school. Those close to a grammar school tend to have fewer pupils with previously high attainment (blue) and more with previously medium (green) or low attainment (red). On average, only 23.9% of pupils at non-selective schools within 1km of a competing grammar school have shown previously high attainment compared to 29.3% at schools 10km away (and even this is lower than the national average of 31.5%). Of this difference, a bit more than half is made up by an increase in the number of previously medium-attaining pupils and a bit less than half is made up by an increase in previously low-attaining pupils. For comparison, 91% of pupils at the average grammar school have shown previously high attainment and 9% have shown previously medium attainment.
Figure 5: Secondary school pupil composition by distance from nearest grammar school (2015)
These effects may seem relatively modest, but recall that the number of grammar schools is limited (163 out of more than 3,000 mainstream state secondary schools in England) and each one typically exerts an effect on many non-selective schools in its vicinity. For example, a total of 519 non-selective secondary schools (18% of the total) lie within 5km of a grammar school. It is therefore the aggregate effects that need to be considered. Nevertheless, it is certainly true that grammar schools cater for only a minority of even high-attaining pupils, in part because they are currently few in number.
Figure 6 shows average GCSE attainment levels by subject for selective and non-selective secondary schools in different types of LA. Unsurprisingly, grammar schools (red columns) outperform non-selective schools (blue columns). The differences are greatest in Geography, Religious Studies and Mathematics, where they equate to roughly two grades per pupil. Biology, Physics and Chemistry show the smallest differences – more like one grade per pupil – with other subjects showing intermediate differences (use the drop-down menu to explore them).
Figure 6: GCSE average points score (2015)
It is also important to note that non-selective schools in non-selective LAs (dark blue) tend to outperform those in partially selective LAs (medium blue), which in turn usually do better than the ones in fully selective LAs (light blue). This makes sense since the latter group faces the most competition from grammar schools.
A pupil's-eye view
The analyses above only address the question of the zero-sum game of allocating the most able pupils: the more who are allocated to grammar schools, the worse other schools perform. They don't address the question of whether similarly able pupils at non-selective schools do any better or worse as a result of the presence of grammar schools. There are certainly reasons to believe that they might suffer. For example the absence of some of the highest-ability pupils might deprive them of motivation to keep up, or opportunities to learn from their peers. It could also be the case that grammar schools attract many of the best teachers, leaving other schools struggling to attract similarly effective members of staff. But these are just hypotheses, what do the data say?
Figure 7 shows the average total GCSE points score for pupils with medium or low prior attainment in all non-selective schools that are situated either in non-selective LAs (dark blue) or fully selective LAs (light blue). It reveals a small but noticeable effect. The difference among pupils with medium prior attainment is 9.5 points, which equates to between one and two grades (eg, an improvement from C to B in one or two subjects). The difference among pupils with low prior attainment is smaller, at 2.9 points, which equates to about half a grade.
Figure 7: GCSE average total points score (2015)
Figure 8 shows the same kind of analysis, but uses the GCSE value-added measure, which takes better account of the prior attainment of each individual pupil. Here, too, we see a noticeable difference, with schools in non-selective areas (dark blue) performing better than those in fully selective areas (light blue), both for pupils with medium prior attainment and those with low prior attainment.
Figure 8: GCSE average points score (2015)
To put these variations in context, a score of +30 on this scale would put a school in the top 10% in the country and a score of -30 would put it in the bottom 10%. So the differences in Figure 8 are modest but material.
Figures 7 and 8 looked at subsets of similarly able pupils across all relevant non-selective schools. An alternative approach is to examine the performance of all pupils, but to do so between subsets of schools that have been selected to ensure that we're comparing like with like. Using this different method allows us to test the robustness of the results presented above. It also has the advantage that the available data enable us to look at school performance in individual subjects.
To this end, we compared each non-selective school that is located in a fully selective LA with a corresponding non-selective school located in a non-selective LA. The schools were matched using an algorithm that minimised their differences in levels of (i) prior attainment, (ii) poverty, (iii) English as an additional language and (iv) special educational needs. This enables us to be reasonably confident that any differences are due to the schools and the selection policies of the LAs rather than the characteristics of the pupils.
Since we will be looking at individual subjects it's important to consider the rate of exam entry as well as average results because we don't want to be misled by schools that achieve high average grades simply by restricting the number of pupils that it enters for an exam. With that in mind, Figure 9 shows the entry rate for difference GCSE subjects at non-selective schools in fully selective LAs (light blue) and otherwise similar schools in non-selective LAs (dark blue). Pupils in selective LAs are less likely to take Physics, Chemistry, Biology, English Language, Design & Technology, Geography, English Literature and History. They are more likely to take Core Science and French. Other subjects show little difference (you can explore them using the drop-down menu).
Figure 9: GCSE entry rates by subject (2015)
Figure 10 shows the average points score by subject. Compared to similar schools in non-selective LAs, those in selective LAs particularly underperform in Religious Studies and Geography. Most other subjects show smaller negative effects. The only subjects not to do so are Core Science, Additional Science and Physics. The average level of underperformance across all subjects is about one attainment point, which equates to 1/6 of a grade for each GCSE subject. To put it another way, across 8 GCSE subjects, each pupil might be expected to get a grade lower in one or perhaps two subjects. This is broadly consistent with the results seen above in Figure 7.
Figure 10: Average GCSE points score by subject (2015)
To summarise, non-selective schools in selective LAs show the follow characteristics at GCSE:
- Higher entry rates and attainment in Core Science and (to a lesser degree) Additional Science.
- Higher entry rates but lower attainment in French and Religious Studies.
- Lower entry rates but slightly higher attainment in Physics.
- Lower entry rates and lower attainment in Geography, Chemistry, Biology, Design & Technology, English Language, English Literature and History.
Thus schools in fully selective LAs tend to favour GCSE Core Science over individual science subjects, and in general they slightly underperform similar schools in non-selective LAs across most subjects.
Many of these differences are relatively small, but it is important to emphasise that they do not seem to be due to the ability (or any other obvious characteristics) of the pupils themselves. Rather, they indicate that, for whatever reason, schools in fully selective LAs behave and perform somewhat differently to those in non-selective LAs even when dealing with ostensibly very similar pupils.
Final destination
Lastly, we will look at where pupils go to continue their studies after school, whether at sixth forms, further education (FE) colleges or universities. In doing so, we will return to the method used in Figures 1 and 2. In other words, we will compare selective LAs with a subset of non-selective LAs that have been chosen to be as similar as possible in other ways. This will allow us to determine if the presence of absence of grammar schools has any noticeable effect on the educational paths followed by the whole annual cohort of students after they leave school.
Figure 11 compares educational destinations at the end of Key Stage 4 (ie, age 16) between fully selective LAs (right) and otherwise similar non-selective LAs (left). The overall progression rate in selective LAs is noticeably higher, but the biggest difference is that students in selective LAs are much more likely to go to sixth form (which are usually more academic) and less likely to go to an FE college (which tend to be more vocational).
Figure 11: Post-16 educational destinations for state secondary schools in England
Note that the publicly available data for 2015 do not yet include information from private schools. Since these are more prevalent in non-selective LAs, it's tempting to think that some or all of the gap could be explained by this omission, but the difference was similar in 2014, which does include data from private schools. Nevertheless, it's also true that private schools are under-represented even in the 2014 data (we estimate ~60% coverage compared to ~90% for state schools), which may explain at least some of the difference seen.
Figure 12 shows data on post-18 educational destinations. At first sight, the figures for 2015 seem to show a substantial difference, with selective LAs sending more students into higher education and many more into elite universities such as Oxbridge or the Russell Group. However, once again, those data are part of a preliminary release and don't yet include information from private schools. The 2014 data do include private schools and the gap here is smaller, though still present. Here too, the results are made a bit difficult to interpret by the fact that the coverage of private schools in the DfE data seems to be a bit lower than for state schools (in this case we estimate ~85% versus ~90%). However, much of the effect is almost certainly real. In other words, selective LAs appear to send more students to university, especially the most competitive ones.
Figure 12: Post-18 educational destinations
Grammar schools, good or bad?
Where does this leave us? As usual, data analysis alone can't provide all the answers, but it can perhaps help us to ask better questions. On the basis of the evidence presented here, grammar schools clearly don't work for everyone. If you care most about getting children out of private education and into the state system, or about maximising the chances of those with a shot at getting into an elite university, then grammar schools seem like a good idea. On the other hand, if you are more concerned with maximising progress among the mass of moderately able children, or in ensuring that we have a widely technically literate population, then in their current form grammar schools appear detrimental to those causes.
To some, the widely spread but generally modest costs imposed on the majority will seem like a worthwhile price if the most academically gifted can be allowed to flourish within the state system. To others, the existence of such inequities, let alone their sanctioning through government policy, is anathema. There are costs and benefits to either path, and which is preferable is ultimately a question of personal and political judgement.
Footnotes: