SchoolDash Stories
Welcome
Here's where we share data-driven stories mined from the millions of facts held in SchoolDash Insights. To be alerted to new ones, sign up for our free monthly-ish newsletter. To make your own discoveries, click on one of the buttons below:
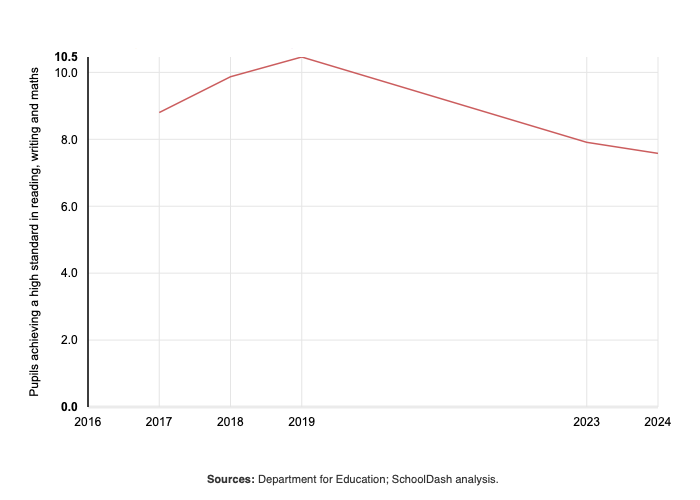
Higher attainment lowers
The proportion of Key Stage 2 (KS2) pupils achieving a high standard in reading, writing and maths has fallen from over 10% before the pandemic to under 8% this year:
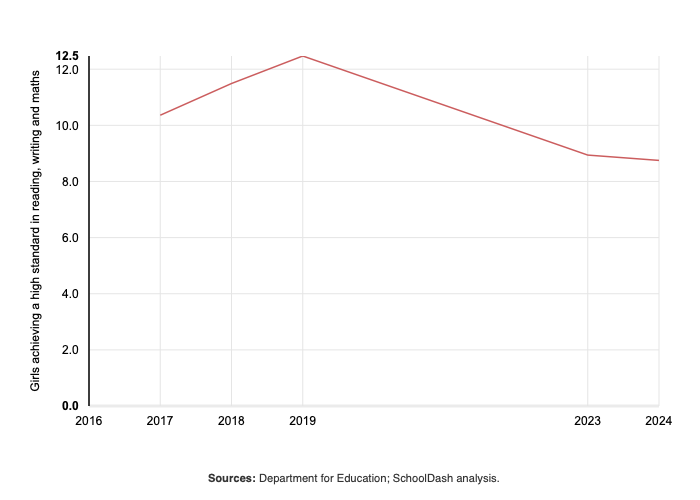
Girls have shown a decline:
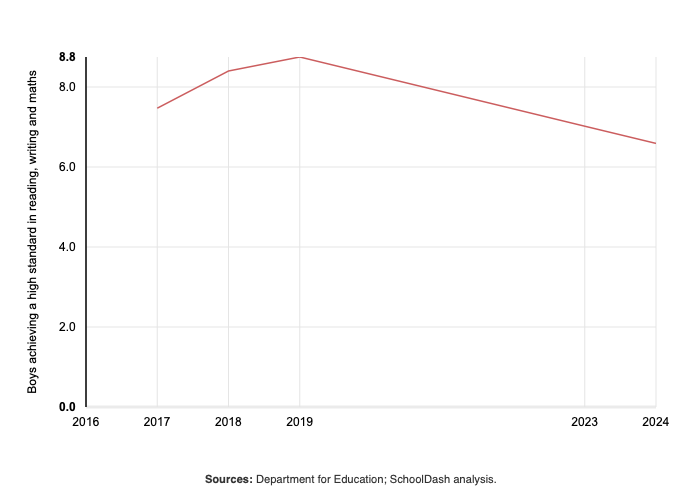
And so have boys, who also are also about 2 percentage points below girls:
Members can find out more about this and other trends in the SchoolDash Insights Exams section. Non-members can sign up for a free trial or write to us to find out more: [email protected].
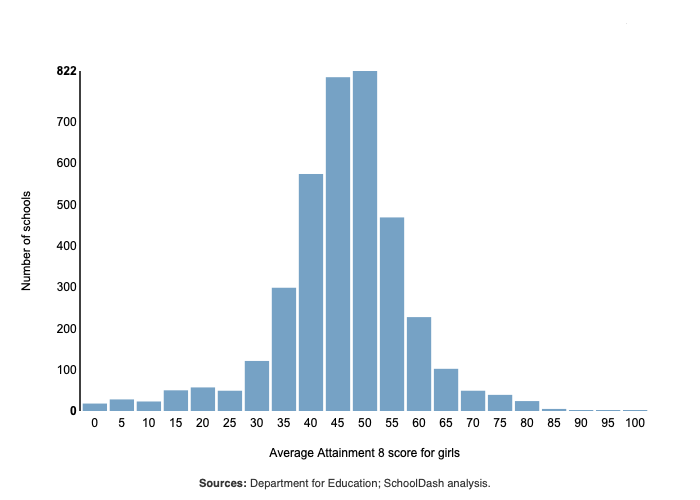
Attainment asymmetries
The Average Attainment 8 score for girls in 2024 was 45.9. Here is the overall distribution:
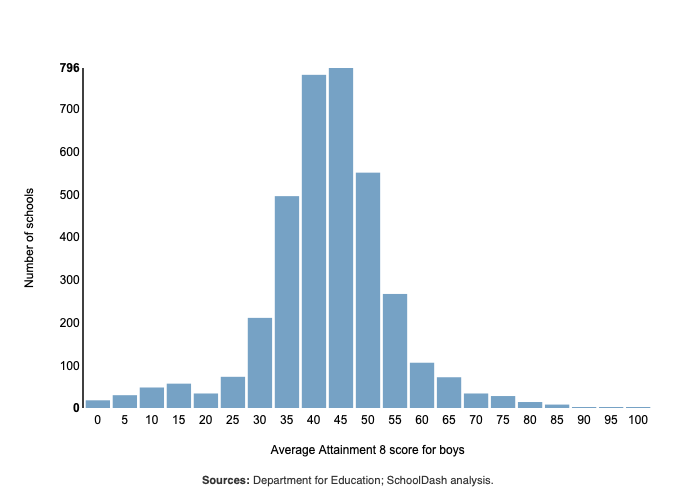
Boys were more than 3 points lower, at 42.5:
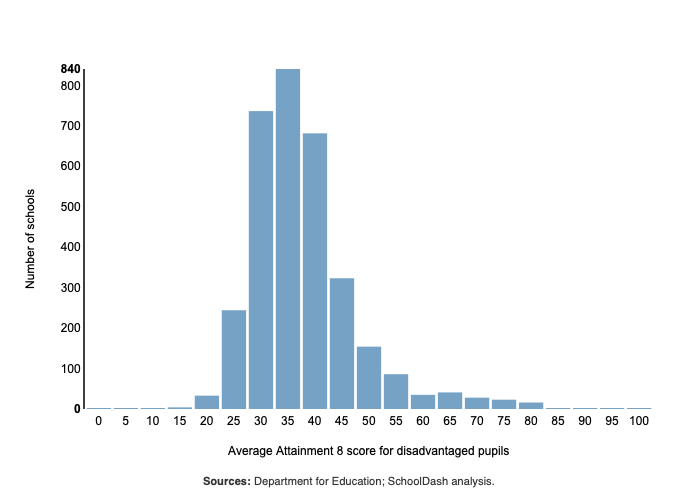
While disadvantaged pupils were at just 37.6:
But EAL (English as an additional language) pupils were much higher than all of these groups, at 51.0:
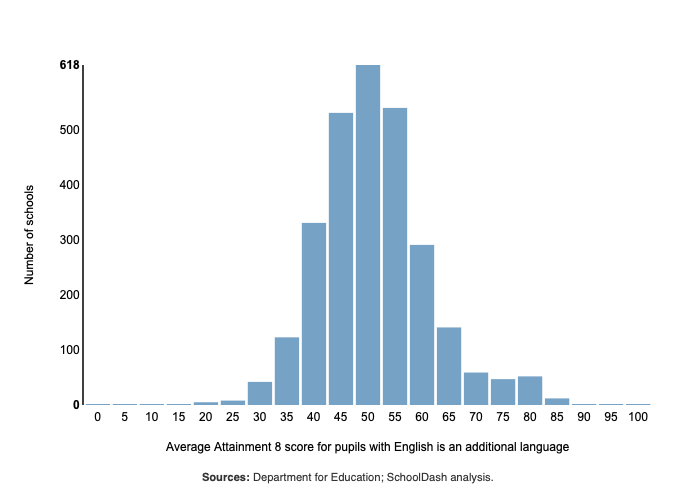
Members can find out more about this and other trends in the SchoolDash Insights Exams section. Non-members can sign up for a free trial or write to us to find out more: [email protected].
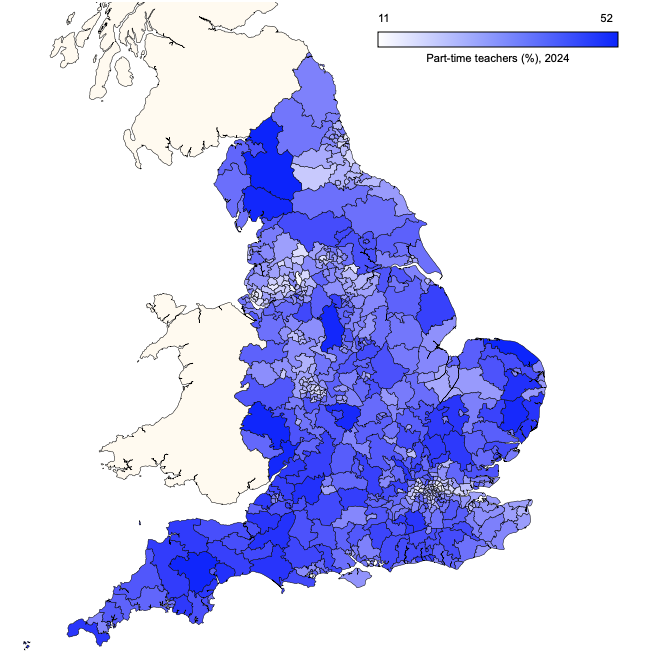
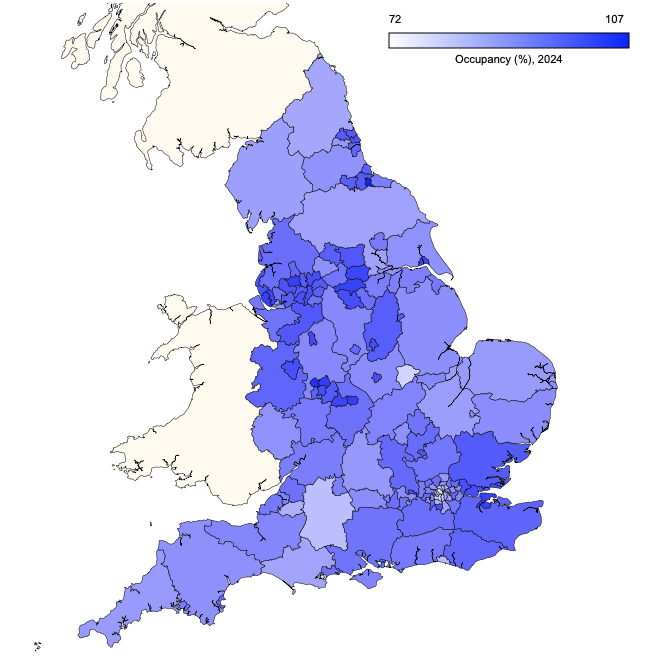
Part-timers
Part-time teachers are much more common outside major urban centres, among primary schools:
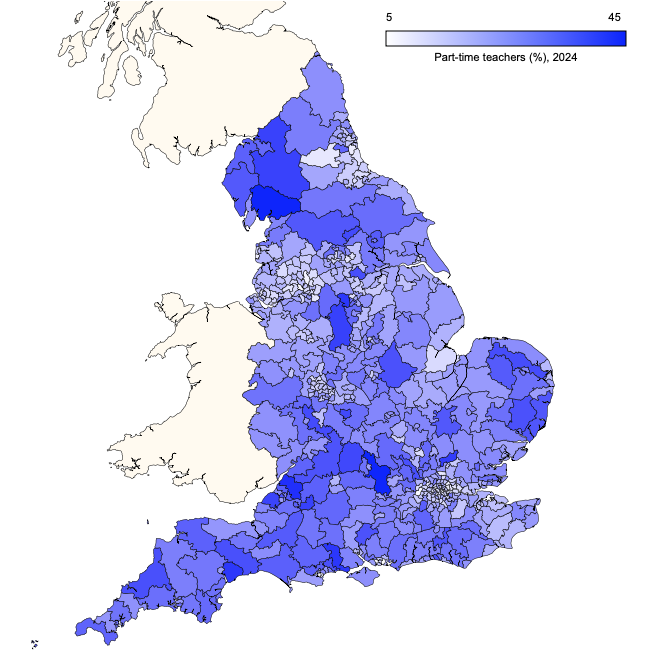
And also secondary schools:
Members can find out more about this and other trends in the SchoolDash Insights Staff section. Non-members can sign up for a free trial or write to us to find out more: [email protected].
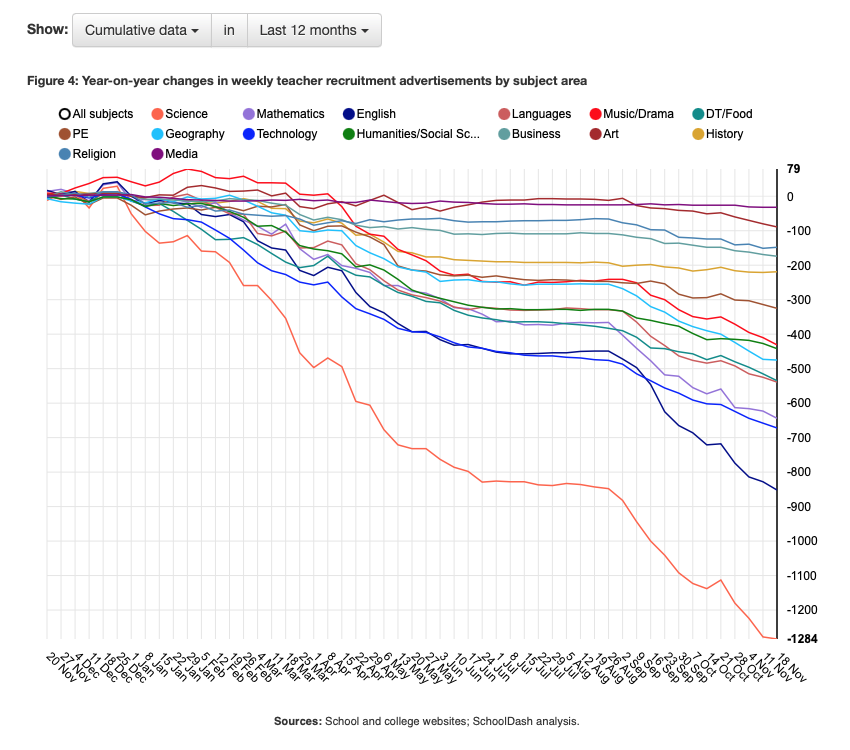
The old normal?
As secondary school recruitment returns to something close to pre-pandemic levels, 2024 has seen reduced numbers of teacher vacancies adverts in all subjects compared to 2023, which was an unusually active year:
Members can find out more about this and other trends in the SchoolDash Insights Recruitment section. Non-members can sign up for a free trial or write to us to find out more: [email protected].
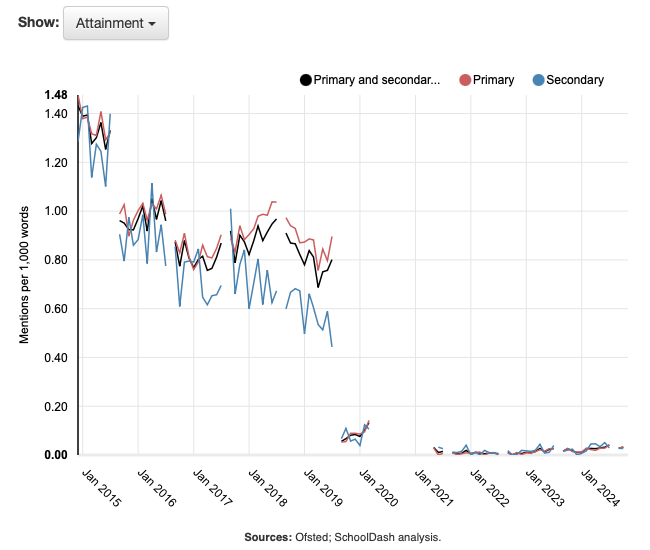
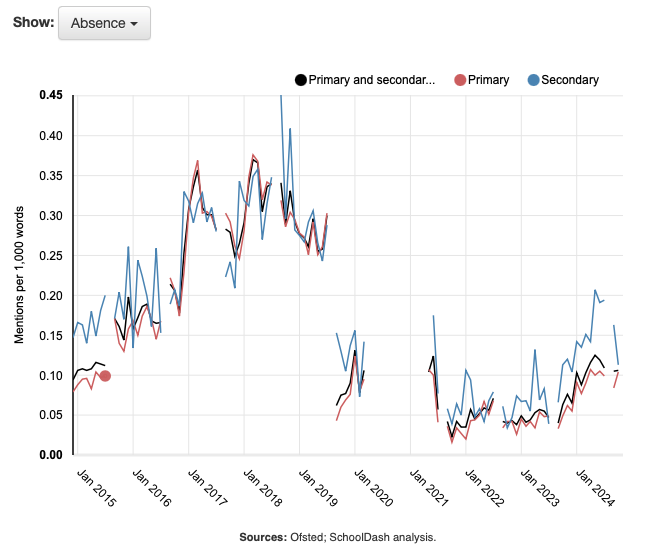
Ofsted inclusions and exclusions
Ofsted inspection reports hardly ever mention attainment anymore:
It used to be a similar story for mentions of pupil absence, though this has been on the rise recently:
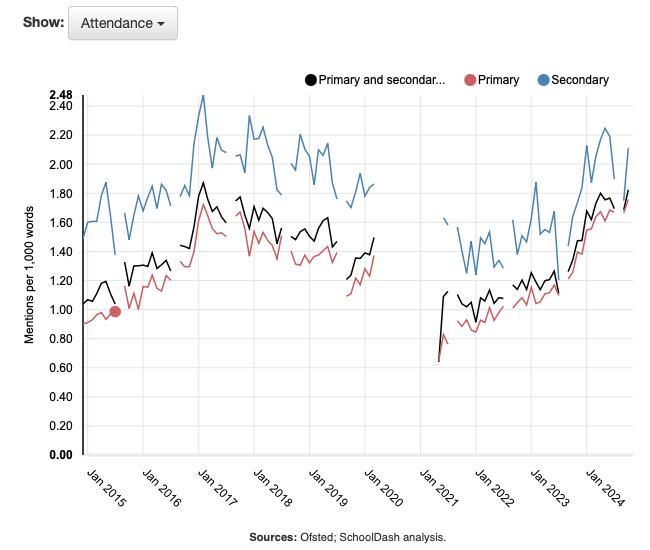
Mentions of attendance have also been increasing:
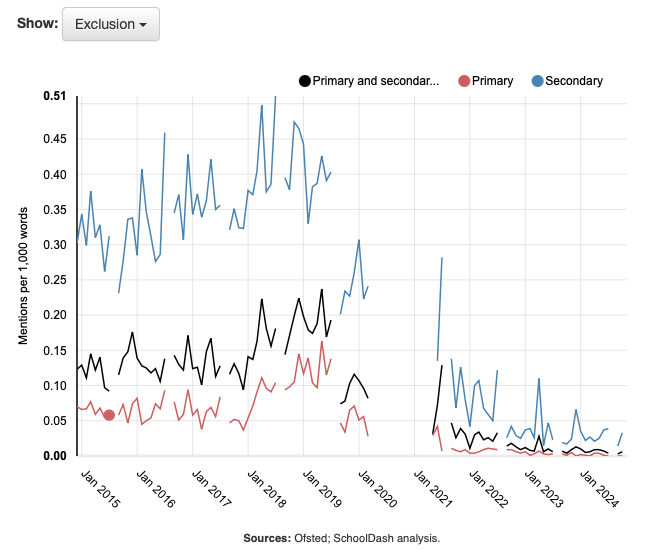
But references to exclusions have all but disappeared:
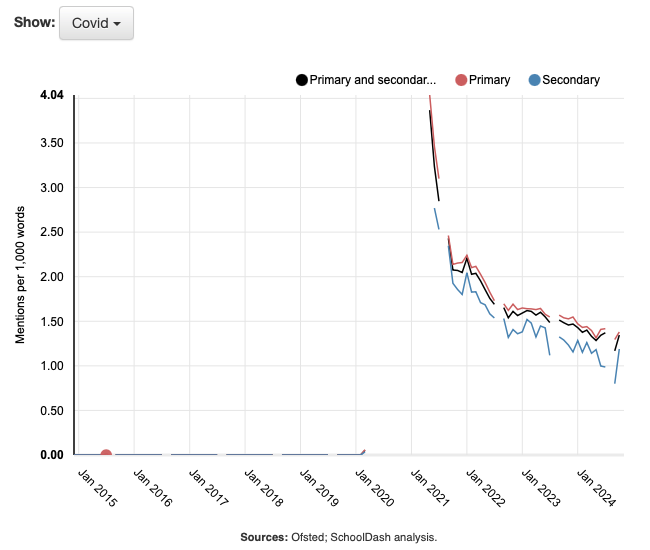
Perhaps surprisingly, mentions of COVID, while declining, are still in evidence:
Members can see the latest trends in these and other terms in the SchoolDash Insights Ofsted section. Non-members can sign up for a free trial or write to us to find out more: [email protected].
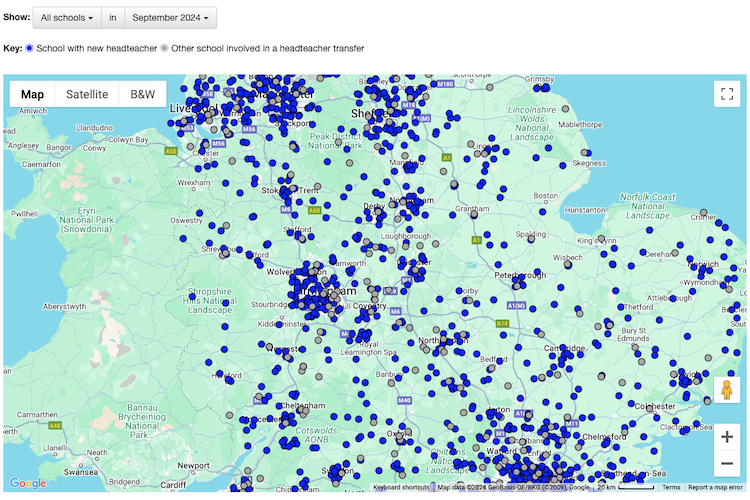
Heads examined
The number of headteacher changes in September 2024 was significantly lower than last year, but similar to 2019, the last pre-pandemic year:
Members can find out more about this and other trends in the SchoolDash Insights Headteachers section. Non-members can sign up for a free trial or write to us to find out more: [email protected].
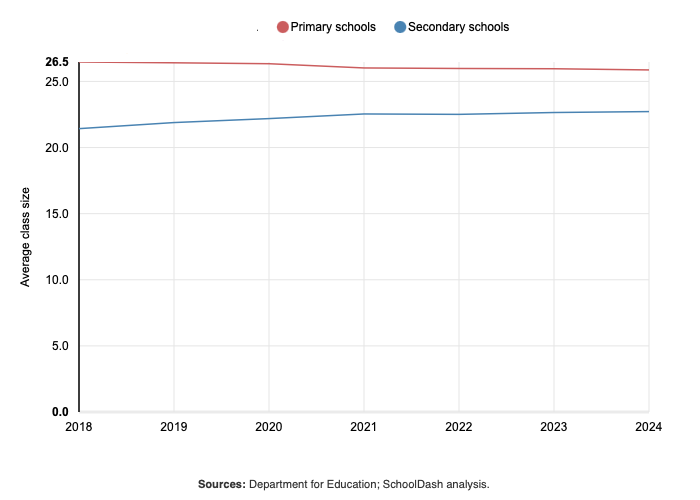
Empty seats
Average class size in primary schools has been falling:
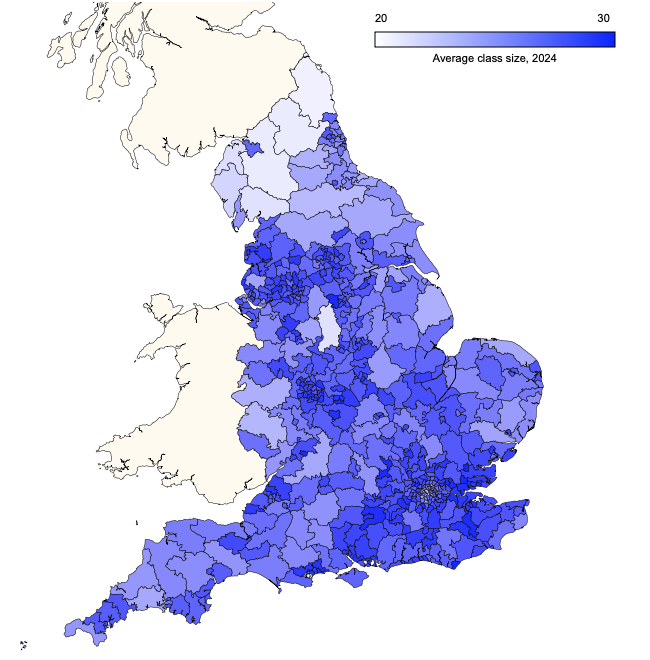
But also varies greatly across the country:
Members can find out more about this and other trends in the SchoolDash Insights Pupils section. Non-members can sign up for a free trial or write to us to find out more: [email protected].
The children of men
Much has been written about falling enrolments at primary schools:
But it is also important to recognise that these are affecting different parts of the country to varying degrees:
Members can find out more about this and other trends in the SchoolDash Insights Pupils section. Non-members can sign up for a free trial or write to us to find out more: [email protected].
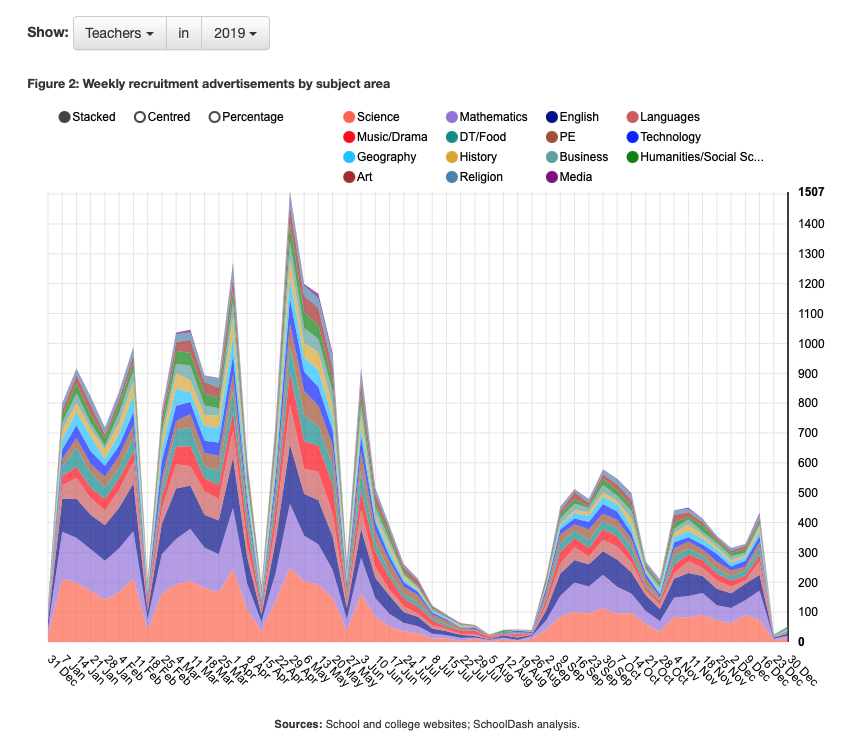
The old normal?
After two 'bust' years in 2020 and 2021, followed by two 'boom' years in 2022 and 2023, school recruiting activity finally appears to be returning to something like it's pre-pandemic level. Compare vacancies advertised on English secondary school and college websites in 2019:
With 2024 so far:
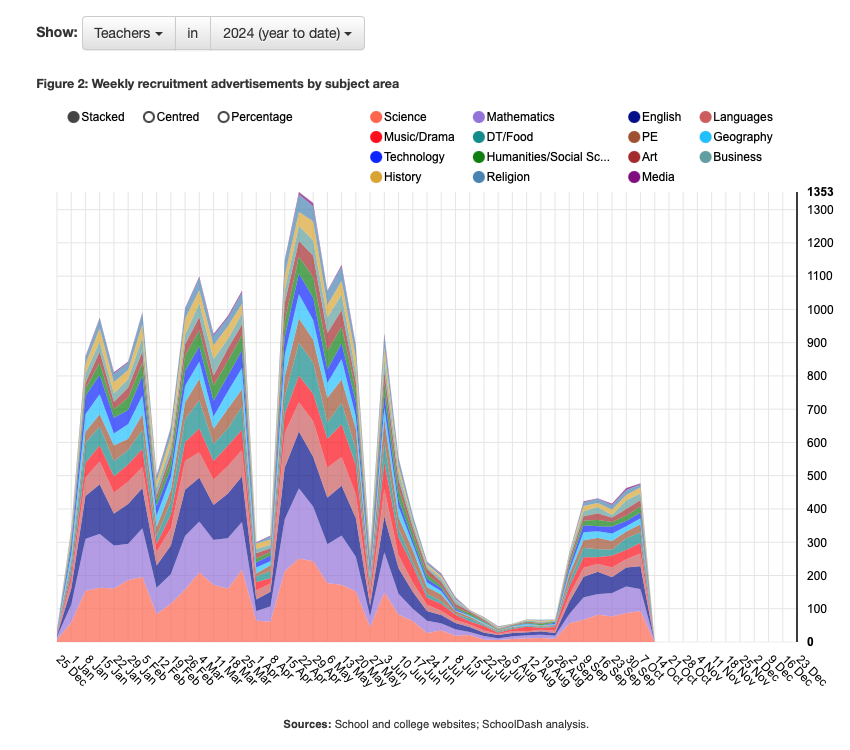
In both cases, we found just over 24,000 vacancy adverts between January and mid-October.
Members can find out more about this and other trends in the SchoolDash Insights Recruitment section. Non-members can sign up for a free trial or write to us to find out more: [email protected].
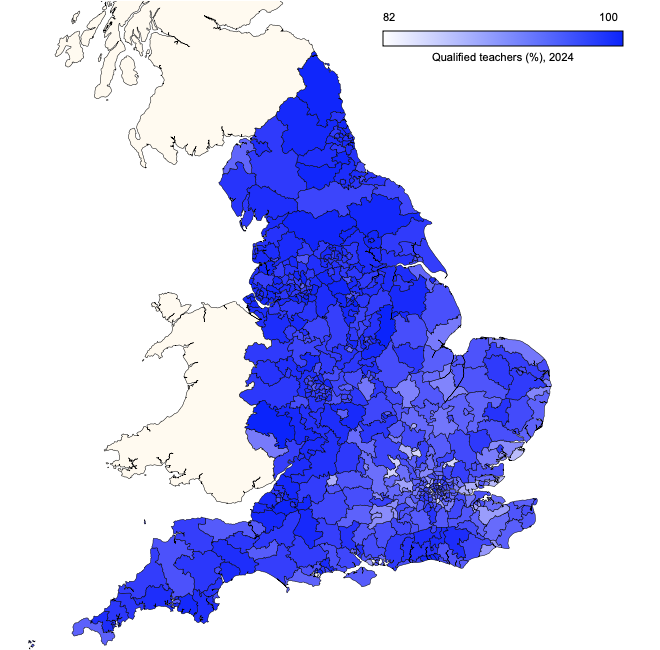
Qualified results
Unqualified teachers are more common in south-eastern parts of England, among primary schools:
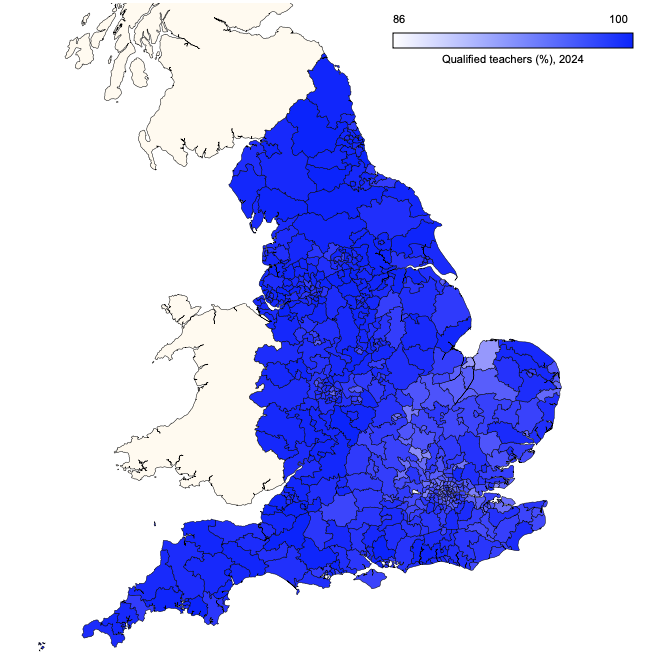
and especially among secondary schools:
Members can find out more about this and other trends in the SchoolDash Insights Staff section. Non-members can sign up for a free trial or write to us to find out more: [email protected].
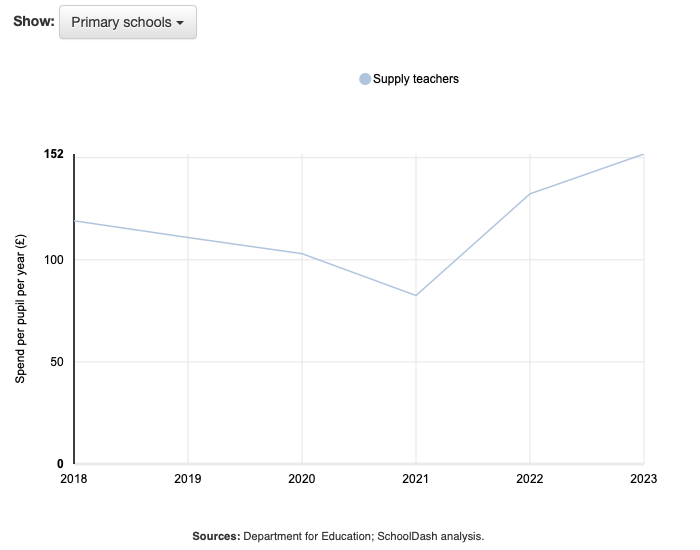
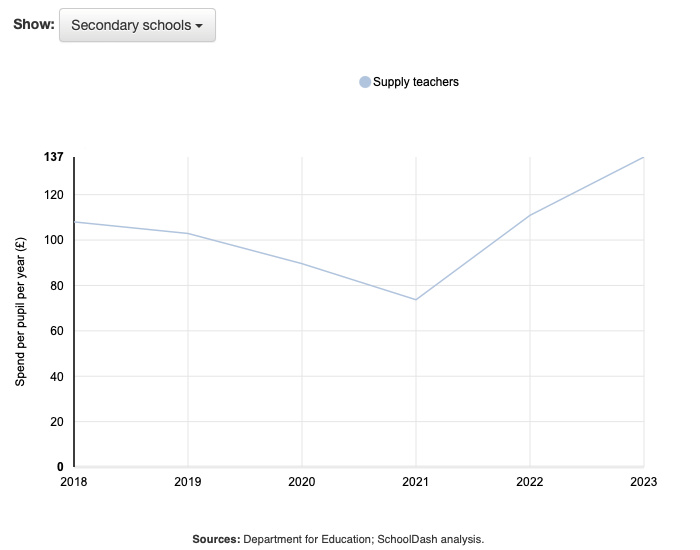
Supply side
Having decline during the pandemic, spending on supply teachers has been rising again, reaching a new high in 2023, the most recent year for which data are available. This applies to primary schools:
and secondary schools alike:
Members can find out more about this and other trends in the SchoolDash Insights Finances section. Non-members can sign up for a free trial or write to us to find out more: [email protected].
Ageing population
The proportion of teachers under 25 has been in long-term decline, driven at least in part by missed teacher-training targets:
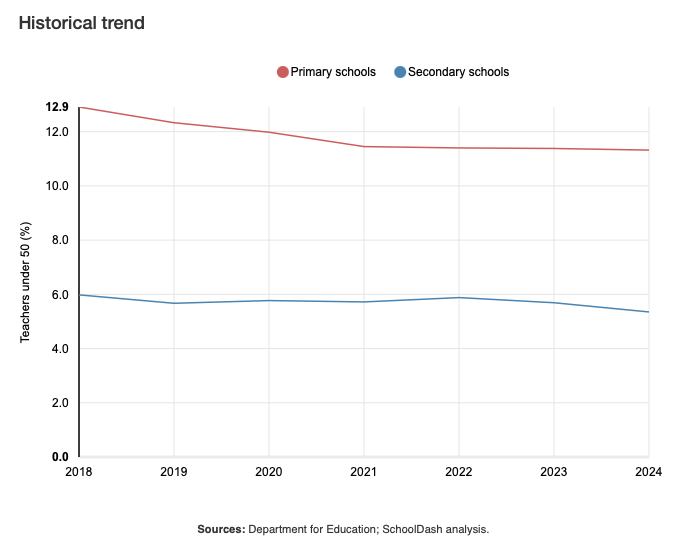
Perhaps inevitably, therefore, the proportion over 50 has been rising:
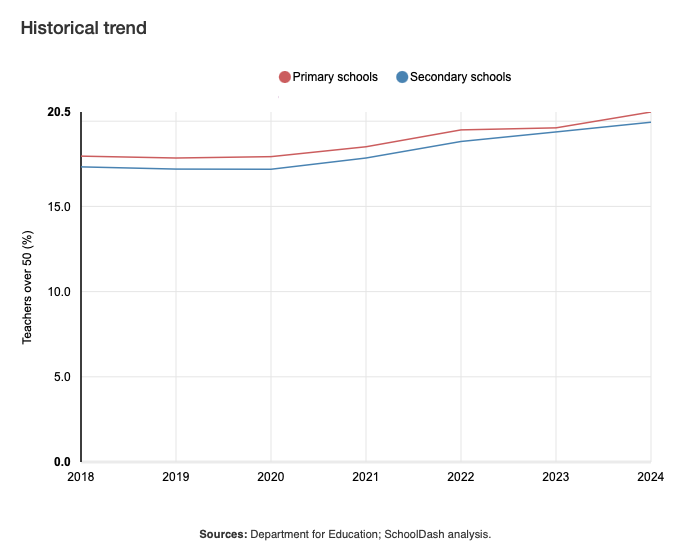
Members can find out more about this and other trends in the SchoolDash Insights Staff section. Non-members can sign up for a free trial or write to us to find out more: [email protected].
Exclusive education
Fixed-term exclusions are very concentrated in certain parts of the country, both among primary schools (where they are relatively rare):
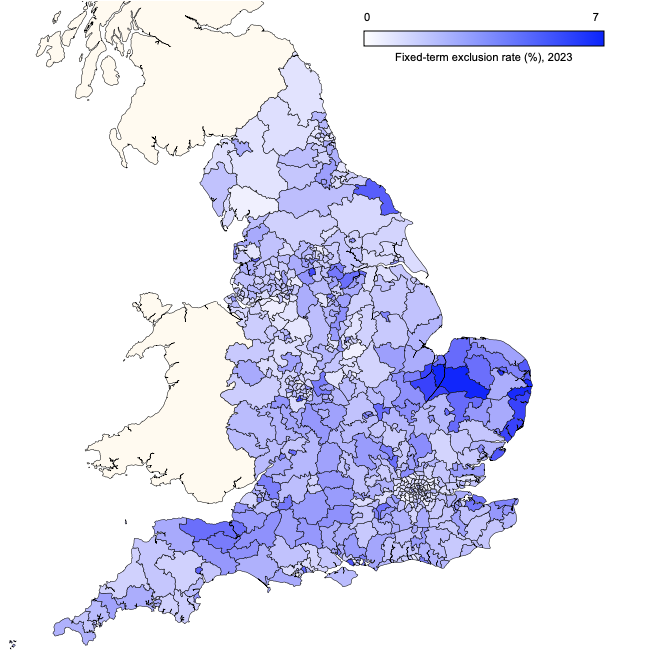
and secondary schools (where they aren't):
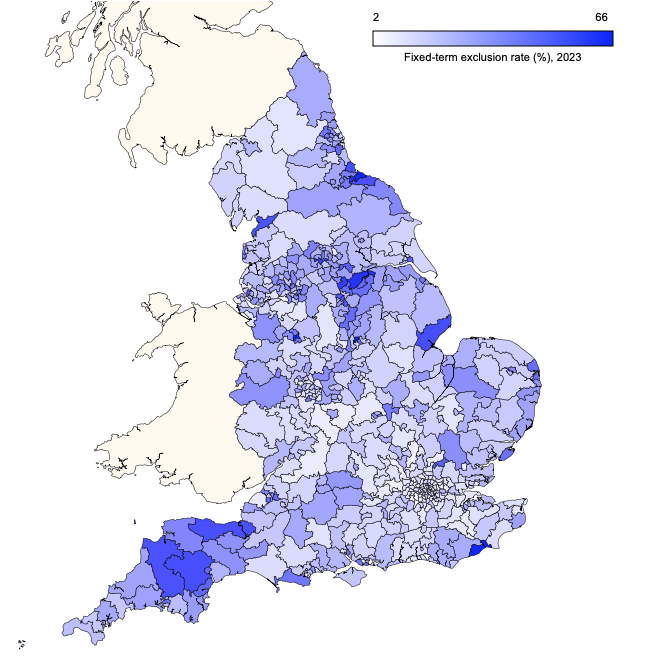
Members can find out more about this and other trends in the SchoolDash Insights Pupils section. Non-members can sign up for a free trial or write to us to find out more: [email protected].
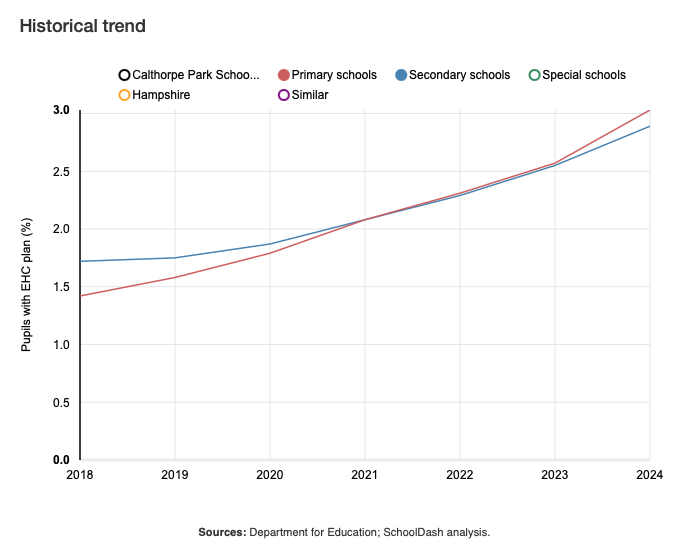
Support plans
The proportion of pupils receiving SEN support has been rising steadily for years:
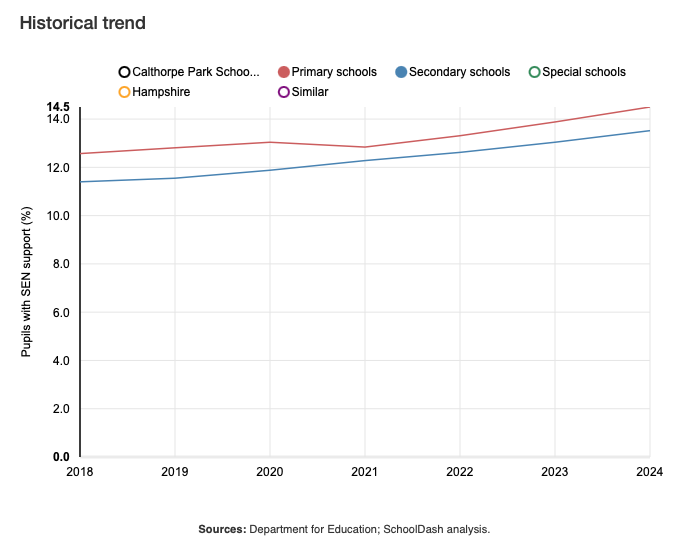
Those with an EHC plan, though less numerous, have been rising even quicker:
Members can find out more about this and other trends in the SchoolDash Insights Pupils section. Non-members can sign up for a free trial or write to us to find out more: [email protected].
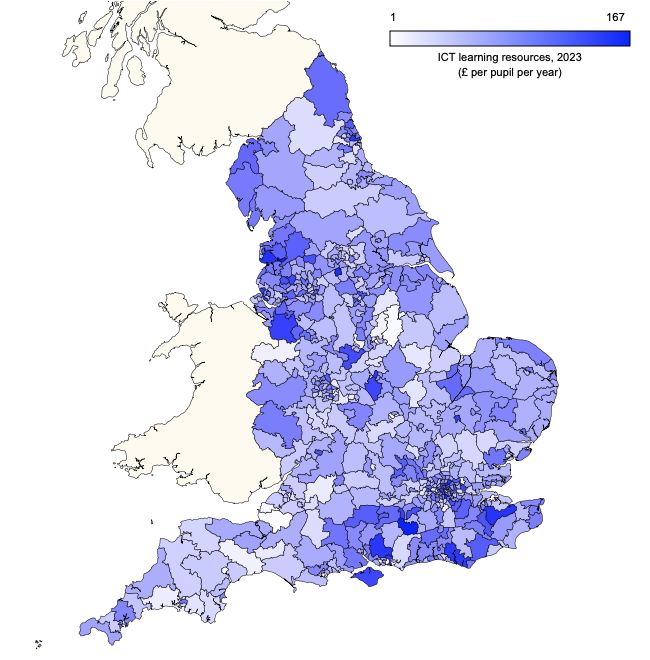
Digital divide
Some parts of the country have been spending much more than others on digital learning. This applies to primary schools:
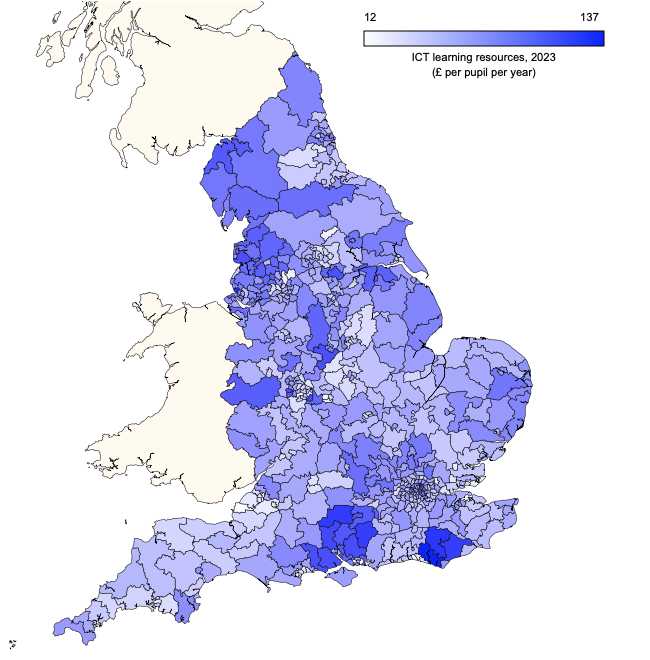
and secondary schools:
Members can find out more about this and other trends in the SchoolDash Insights Finances section. Non-members can sign up for a free trial or write to us to find out more: [email protected].
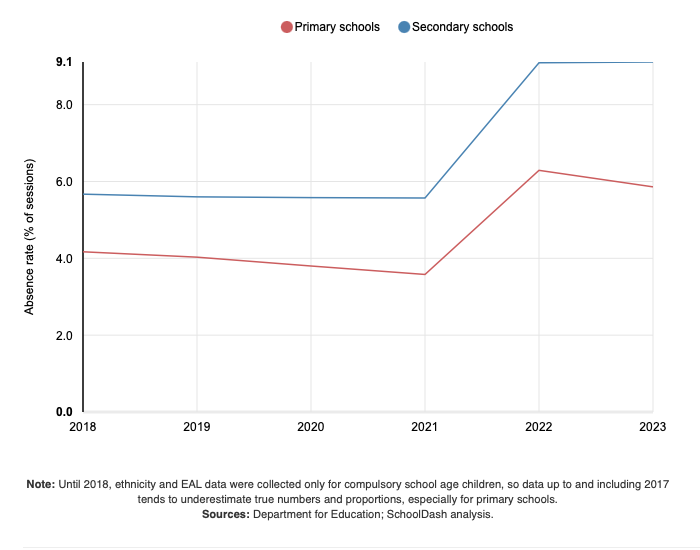
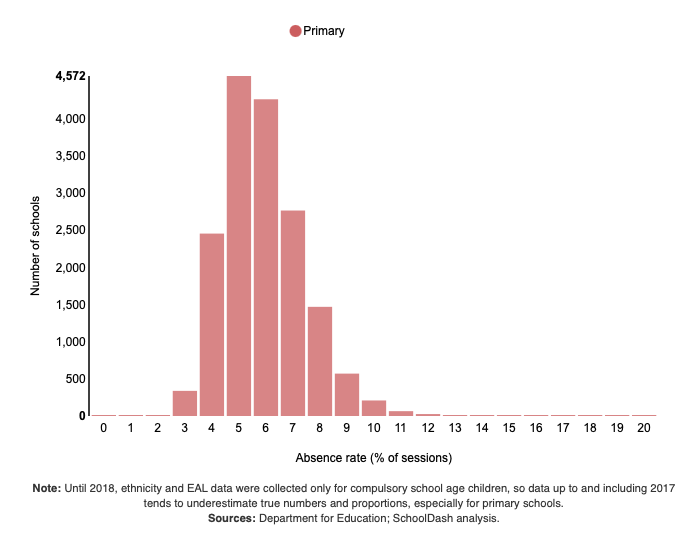
Evidence of absence
The latest absence data from the DfE show that the steep post-pandemic rise seen in 2022 was sustained into 2023:
The rate varies considerably among primary schools:
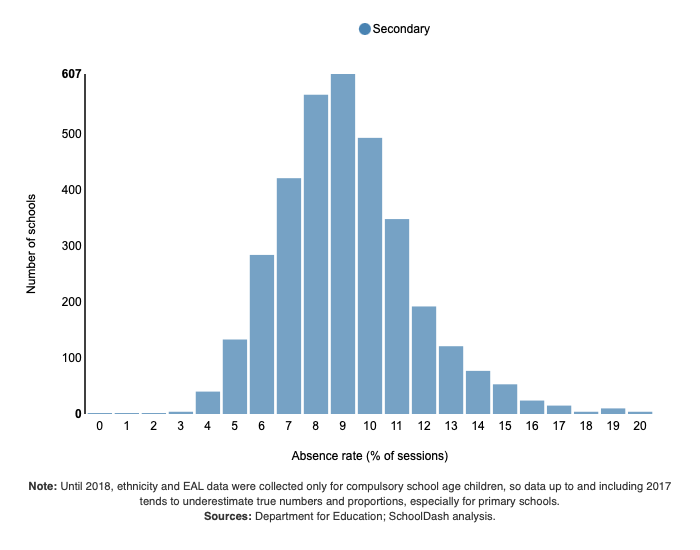
And secondary schools:
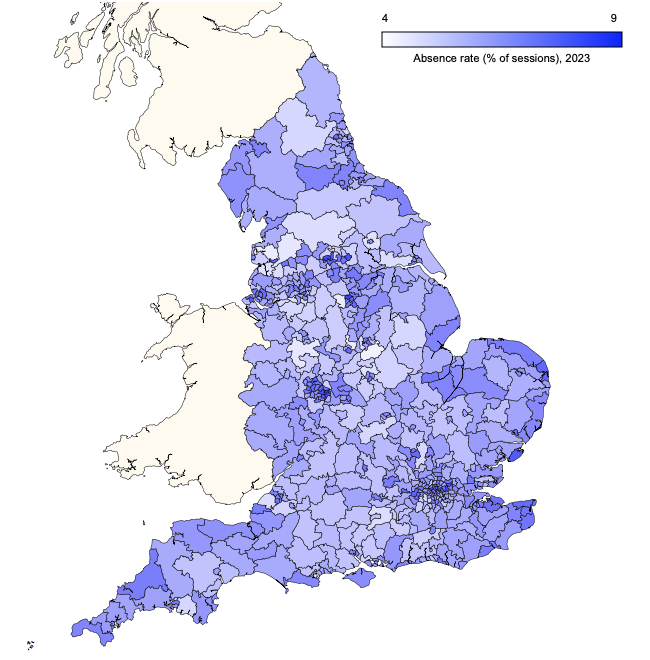
There is also considerable local variation among primary schools:
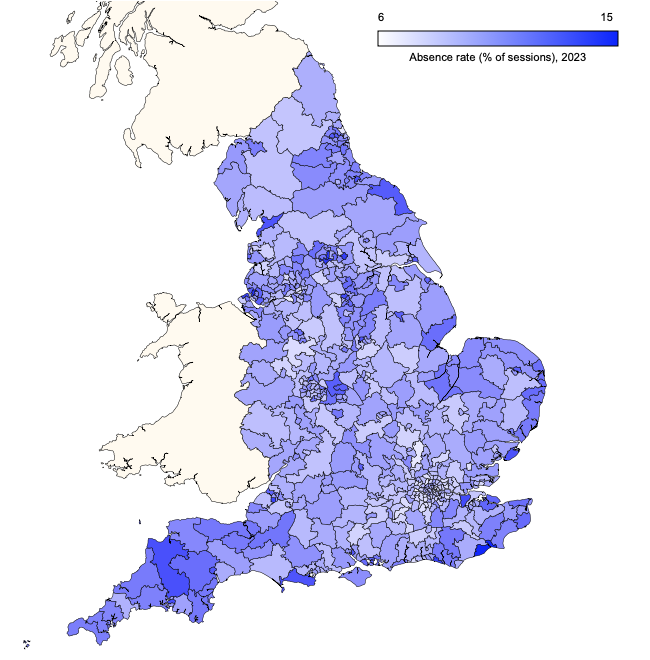
And among secondary schools too:
Members can find out more about this and other trends in the SchoolDash Insights Pupils section. Non-members can sign up for a free trial or write to us to find out more: [email protected].
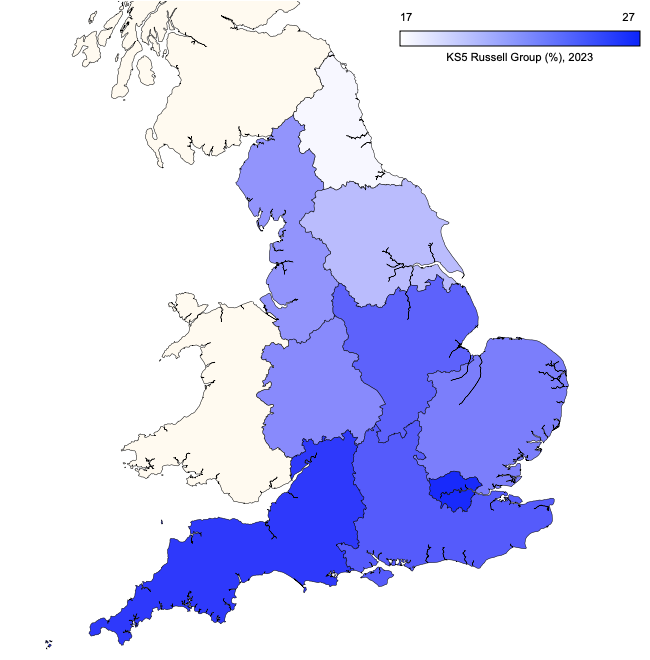
Aiming higher
The highest proportions of students going to Russell Group universities are in London and the South West:
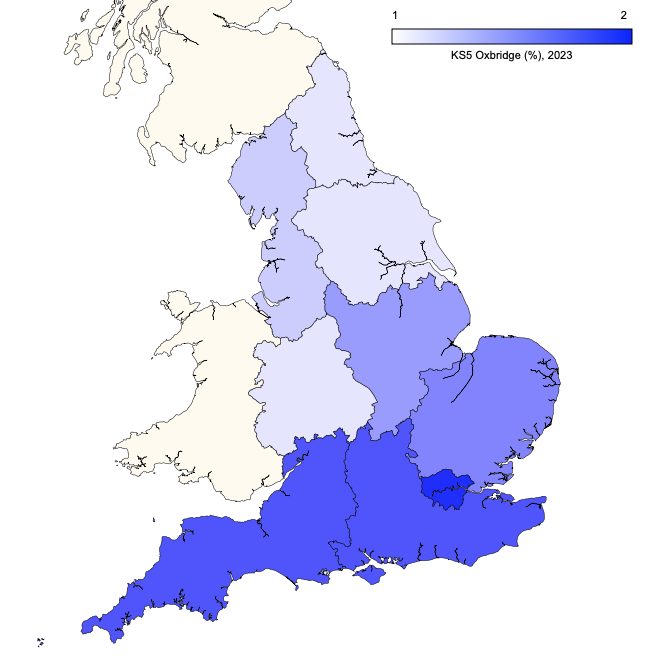
Students going to Oxford or Cambridge tend to be in London and the South:
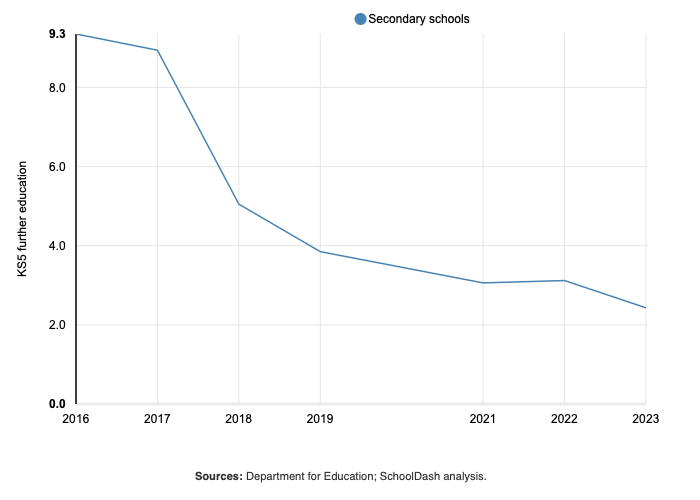
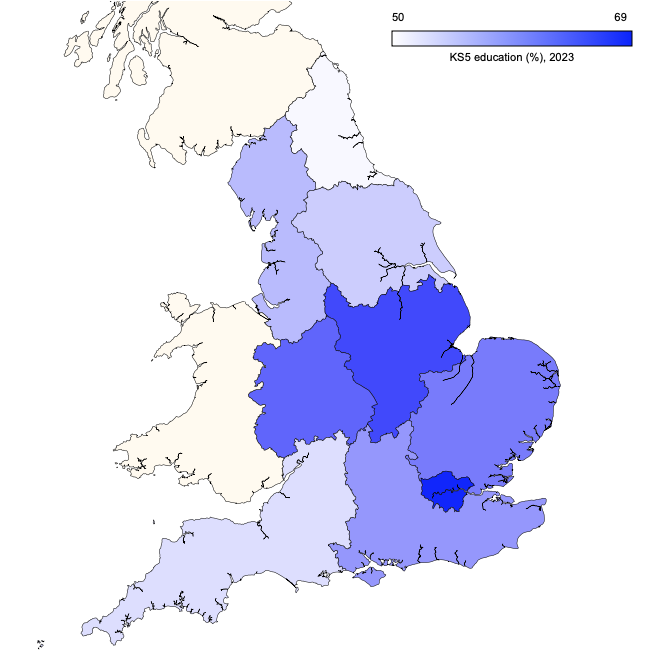
Some Key Stage 5 students go into further (rather than higher) education, but this proportion has been in steep decline:
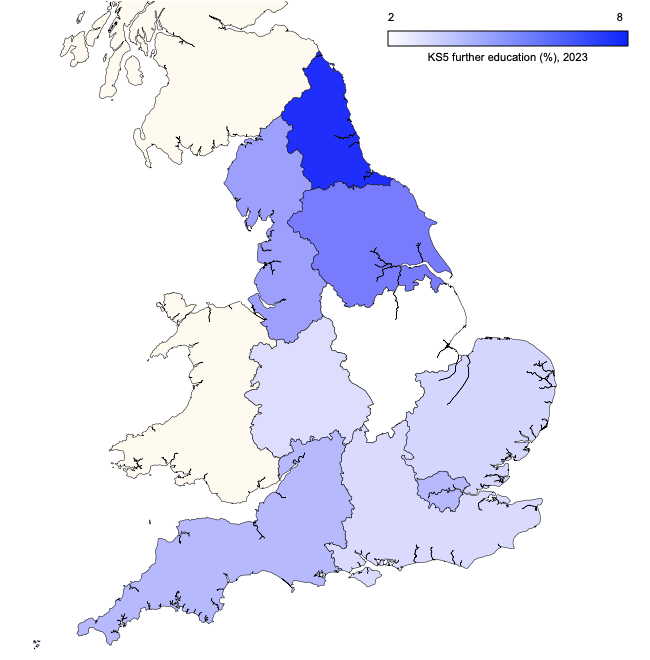
In 2023, it was highest in the North East:
Members can find out more about this and other trends in the SchoolDash Insights Destinations section. Non-members can sign up for a free trial or write to us to find out more: [email protected].
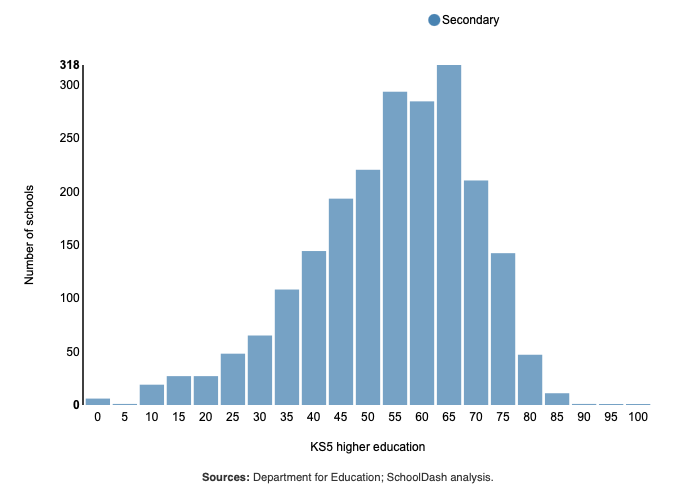
Aiming higher
Over half of Key Stage 5 students to to a higher education destination of one kind or another:
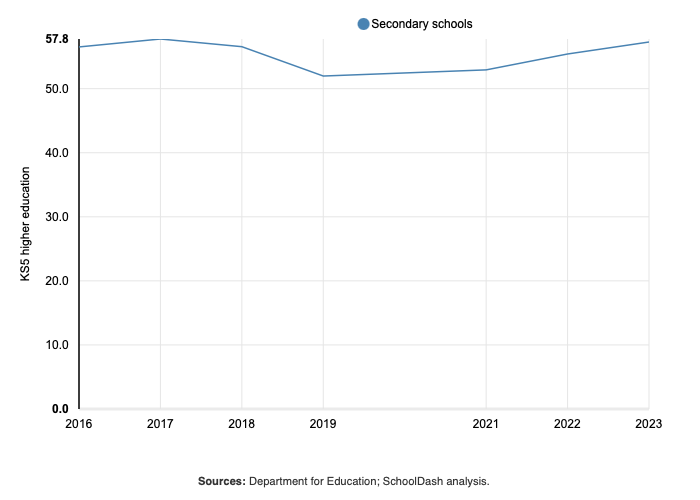
But this varies enormously by individual school or college:
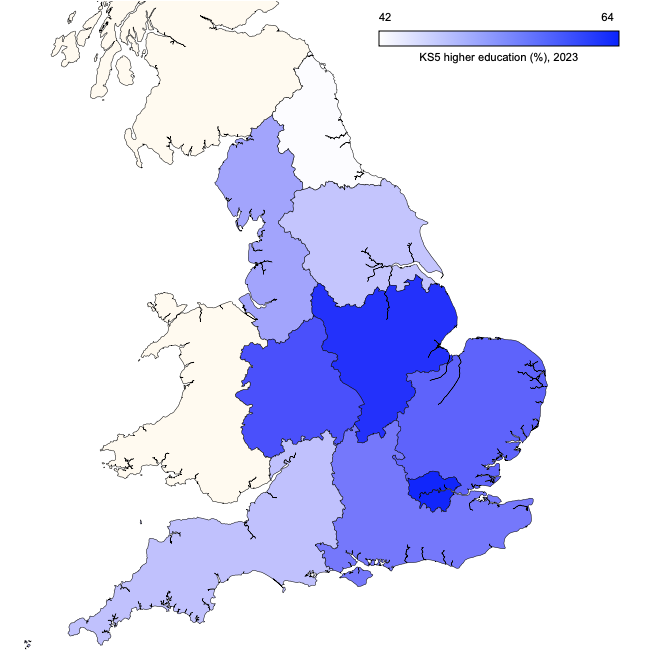
It is highest in London and the Midlands, and lowest in the North East:
Members can find out more about this and other trends in the SchoolDash Insights Destinations section. Non-members can sign up for a free trial or write to us to find out more: [email protected].
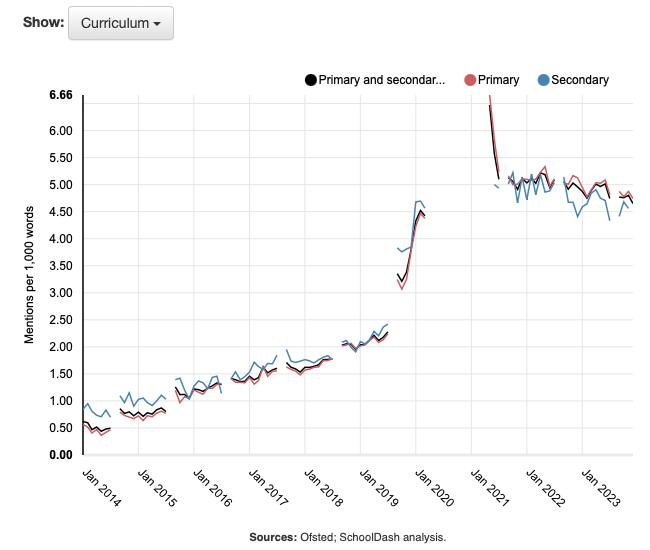
Ofsted ups and downs
Ofsted reports are mentioning "curriculum" more than ever:
The same is true of "careers", at least for secondary schools:
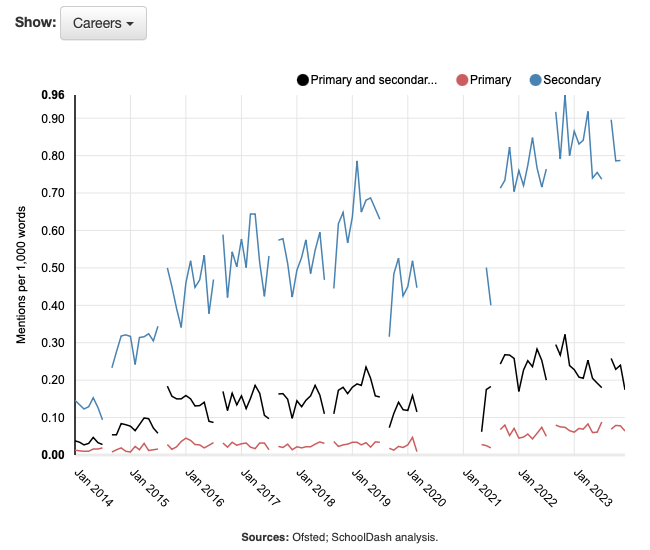
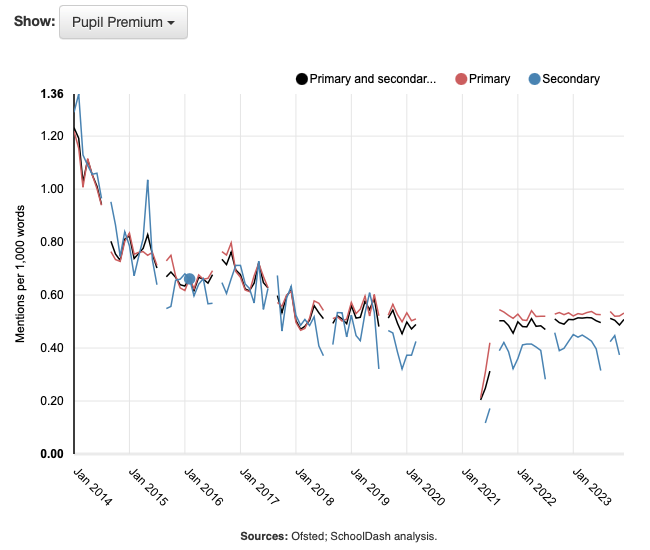
But mentions of "Pupil Premium" have been in decline:
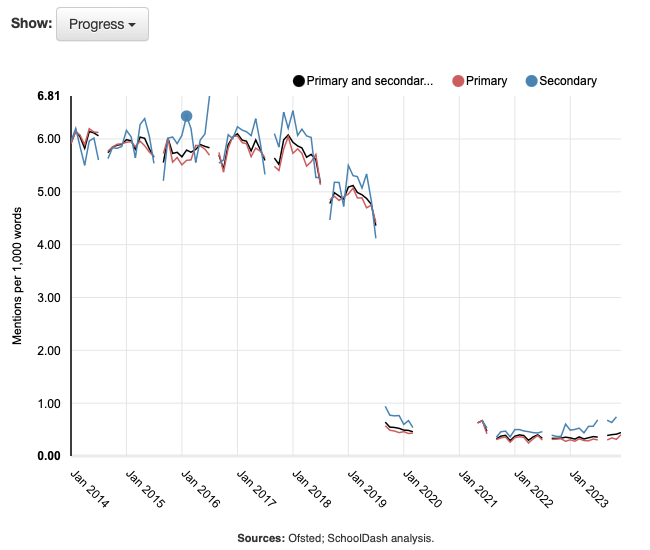
And these days "progress" is hardly mentioned at all:
Members can see the latest trends in these and other terms in the SchoolDash Insights Ofsted section. Non-members can sign up for a free trial or write to us to find out more: [email protected].
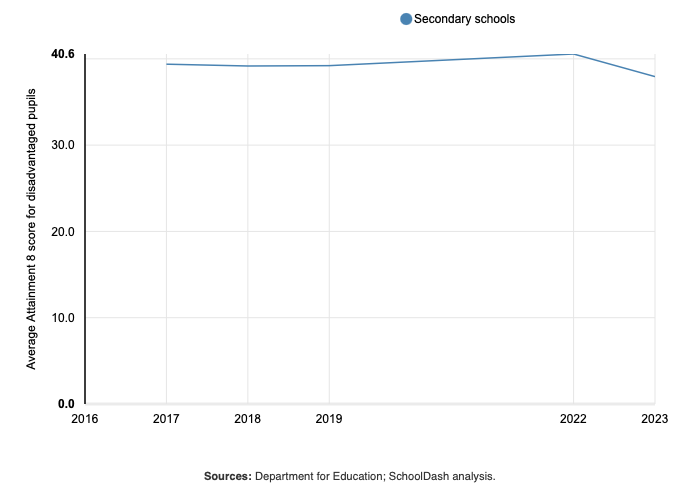
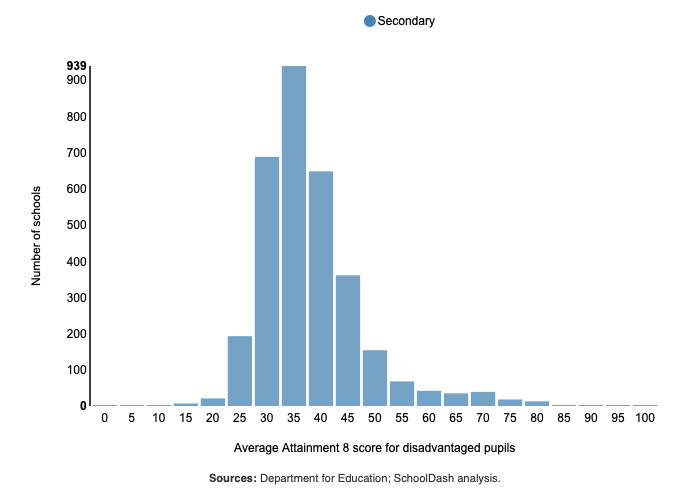
Attainment 8 and disadvantage
In 2023, the average Attainment 8 score for disadvantaged pupils was about 38 (compared to almost 45 for all pupils):
This varied considerably by school:
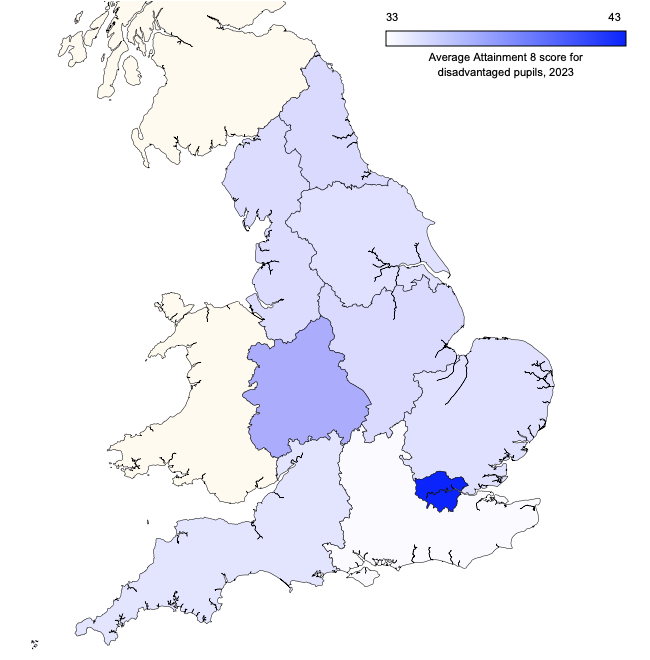
It was much higher in London than in other regions:
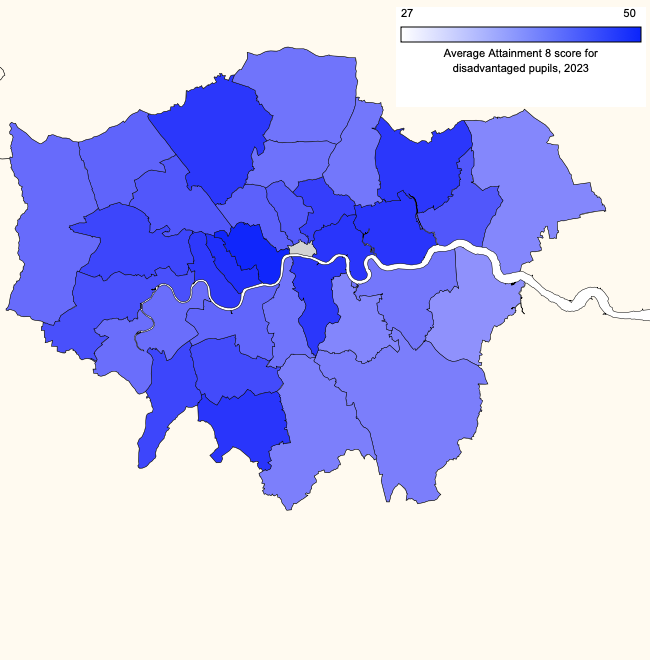
But even within London this measure varied:
Members can find out more about this and other trends in the SchoolDash Insights Exams section. Non-members can sign up for a free trial or write to us to find out more: [email protected].
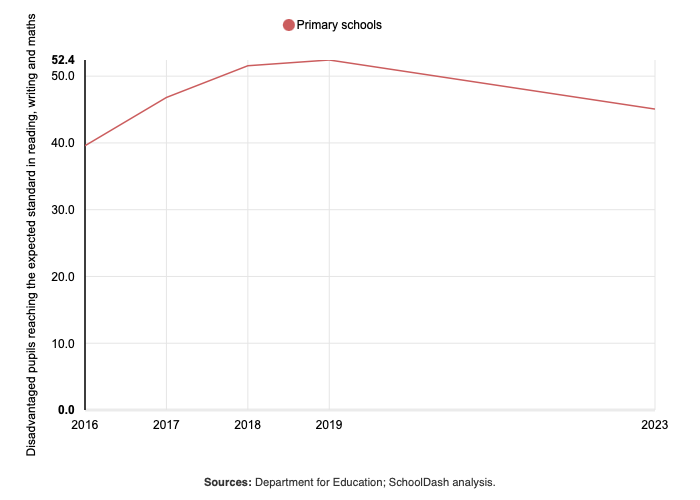
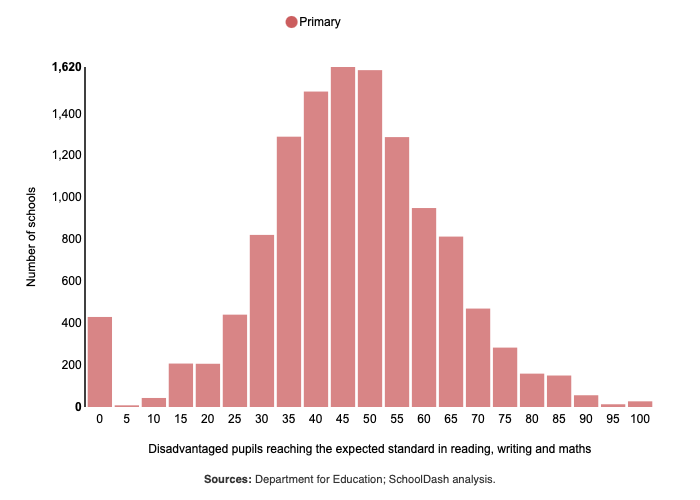
Primary performance and poverty
Less than half of disadvantaged pupils in Key Stage 2 reach expected standards in reading, writing and maths:
This measure varies widely by school:
The proportion is much higher in London than in other regions:
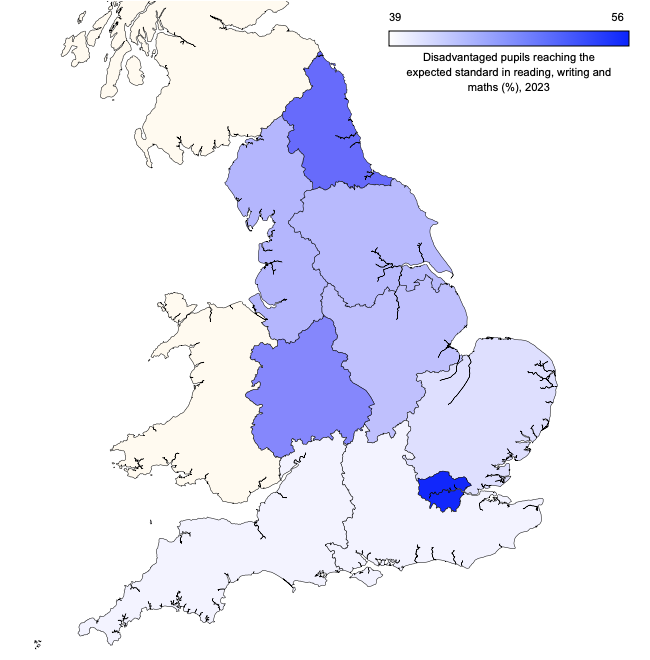
But these regional averages hide lots of local variation:
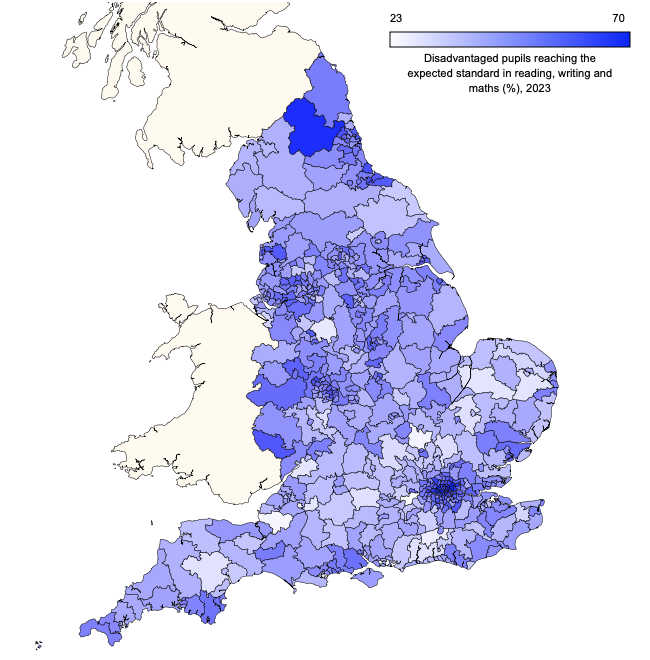
Members can find out more about this and other trends in the SchoolDash Insights Exams section. Non-members can sign up for a free trial or write to us to find out more: [email protected].
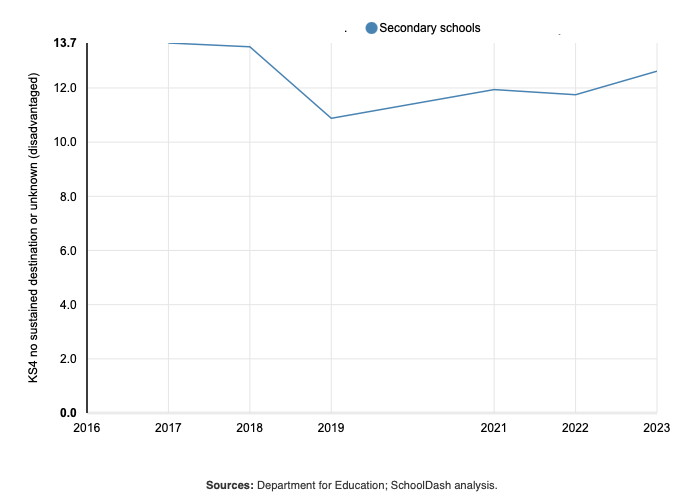
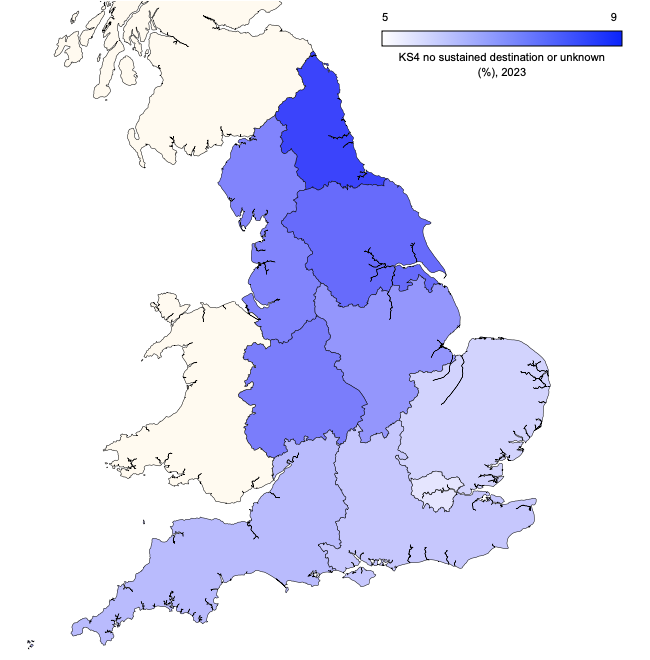
The disadvantage of NEET
About 12% of disadvantaged Key Stage 4 pupils have no known educational or employment destination:
This measure is much lower in London than in the rest of the country:
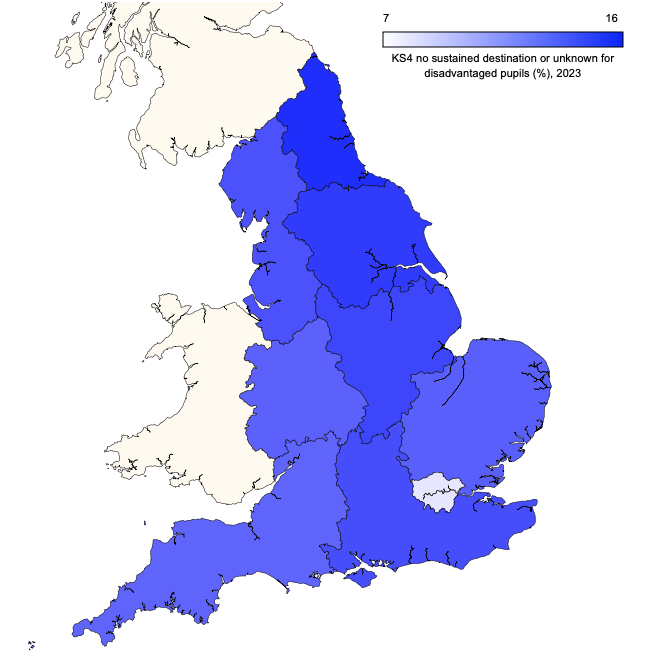
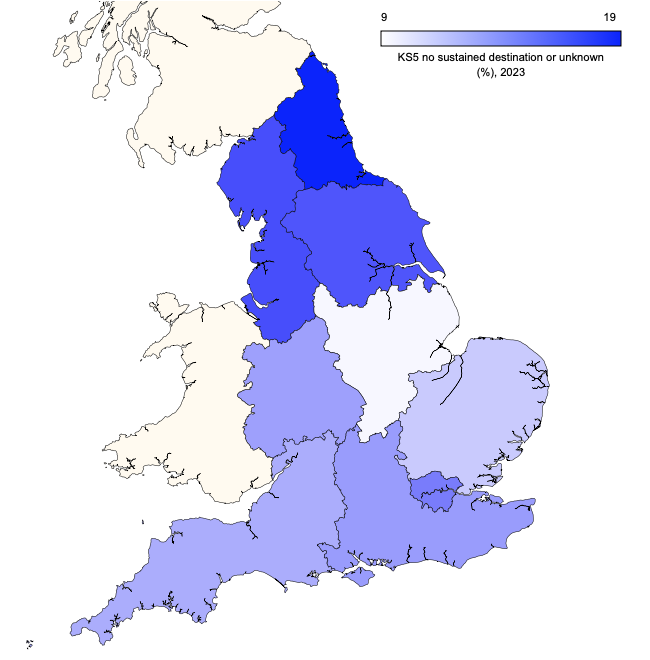
At Key Stage 5, the proportion rises to about 20%:
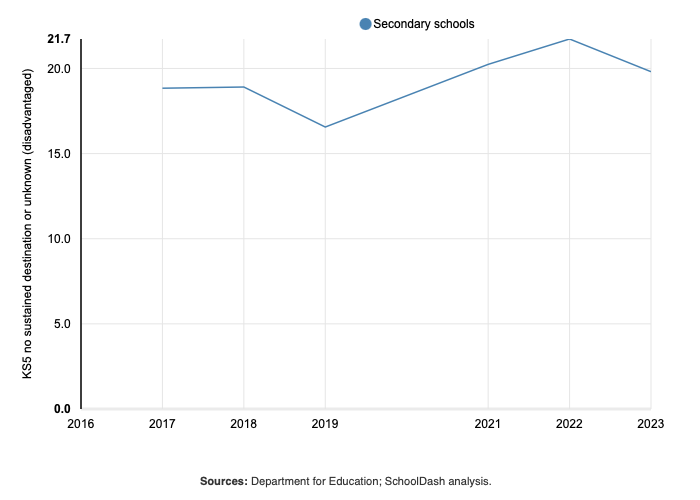
Even higher proportions of around a third are seen in the north of England:
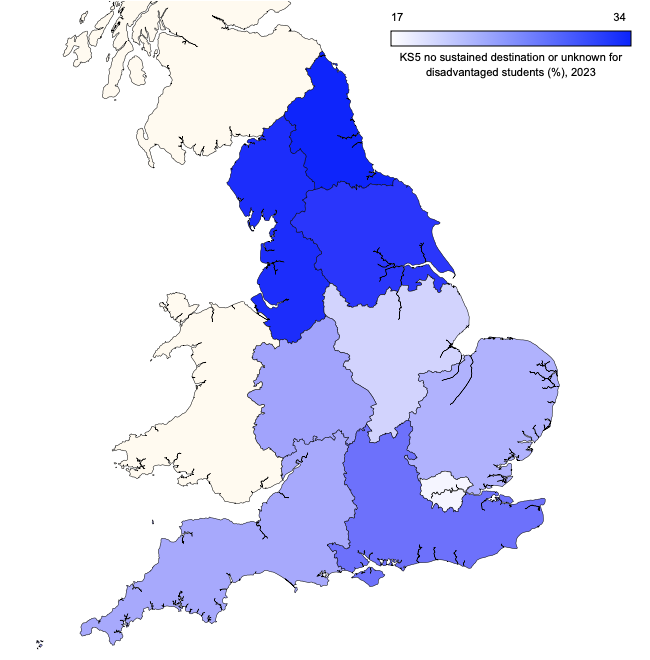
Members can find out more about this and other trends in the SchoolDash Insights Destinations section. Non-members can sign up for a free trial or write to us to find out more: [email protected].
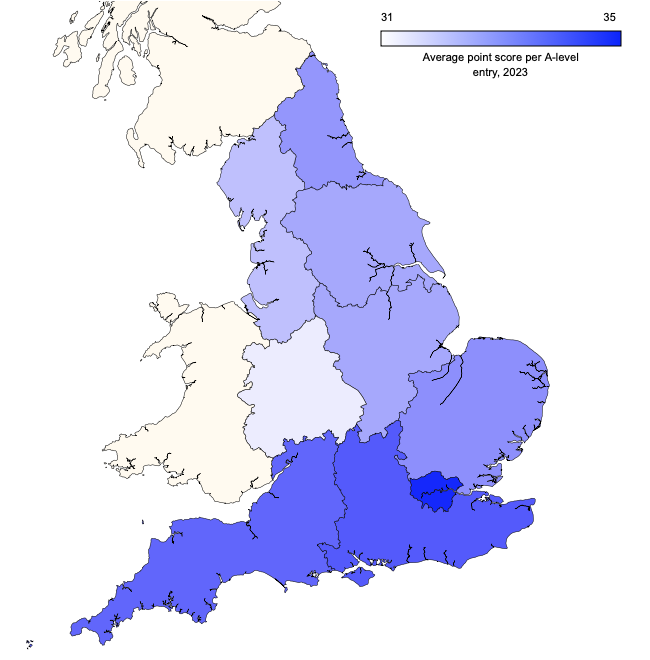
A-level adjustments
Average A-level grades have fallen back to close to pre-pandemic norms:
However, geographical disparities continue to be affected. For example, compare the North East with London in 2019:
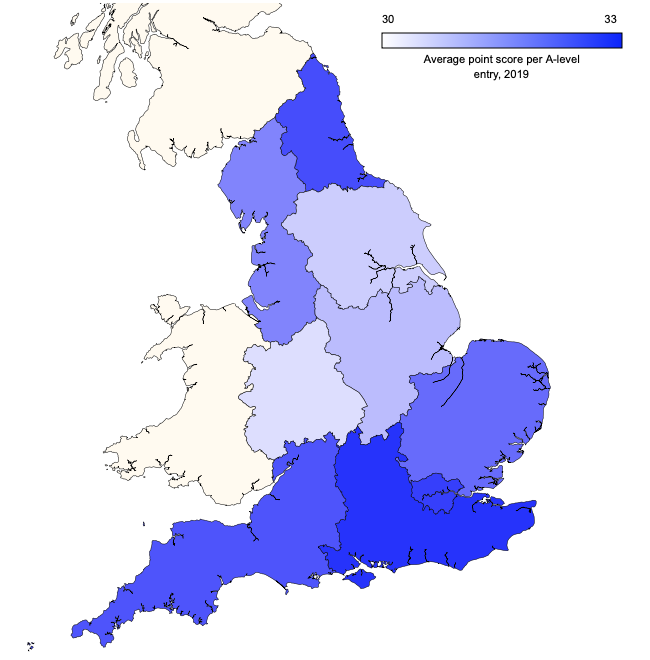
And in 2023:
Members can find out more about this and other trends in the SchoolDash Insights Exams section. Non-members can sign up for a free trial or write to us to find out more: [email protected].
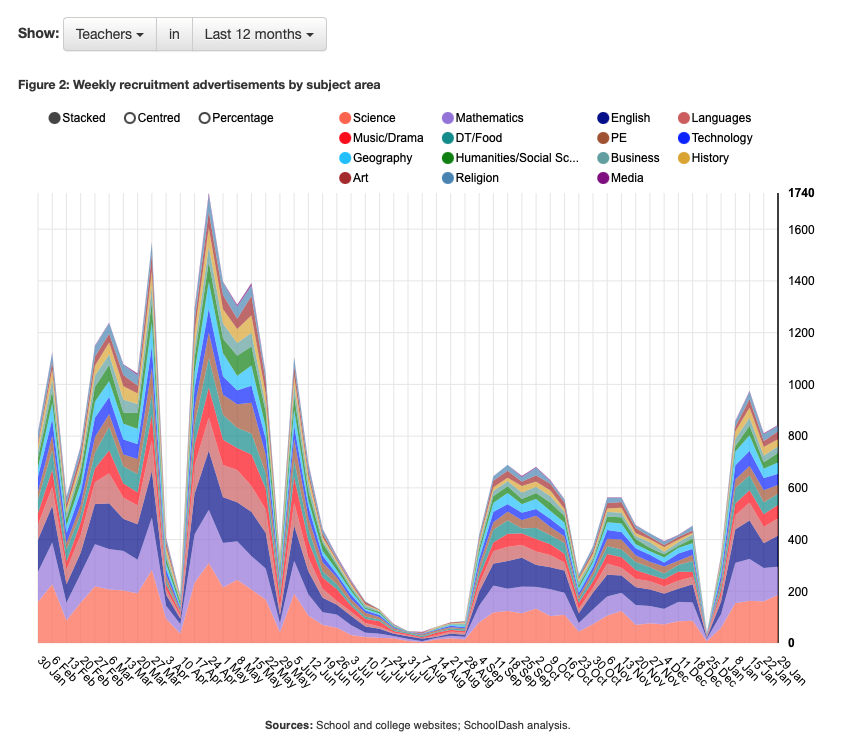
Recruitment rises
As usual for this time of year, teacher recruitment activity among secondary schools has started to pick up. Traditionally, this reaches a peak in late April or early May, but there have been many unusual developments since the pandemic, so only time will tell:
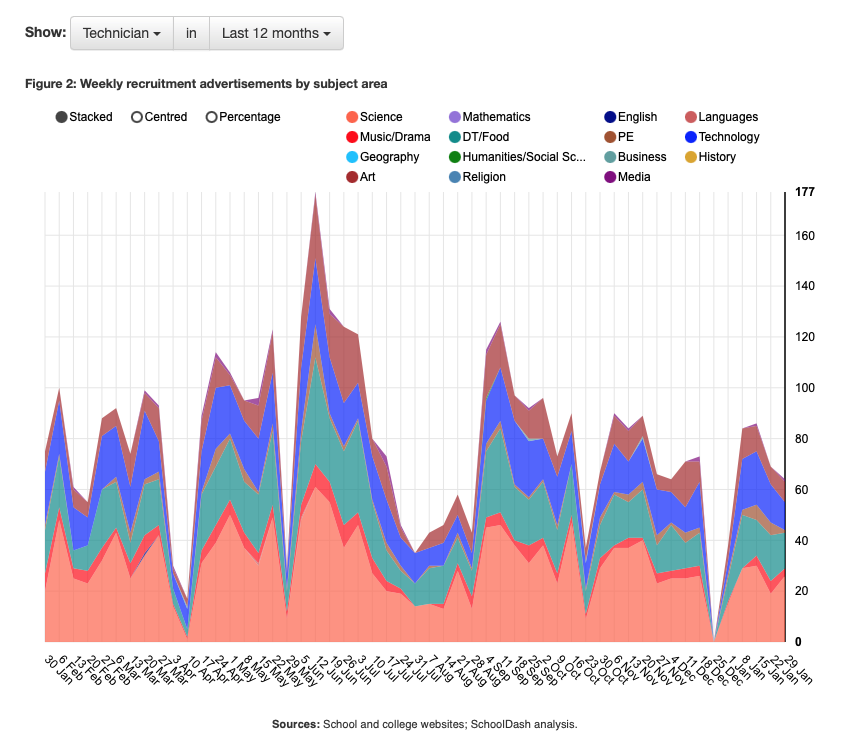
Technician recruitment has also risen, though this is less seasonal and doesn't usually peak until the early summer:
Members can see the latest trends in these and other terms in the SchoolDash Insights Recruitment section. Non-members can sign up for a free trial or write to us to find out more: [email protected].
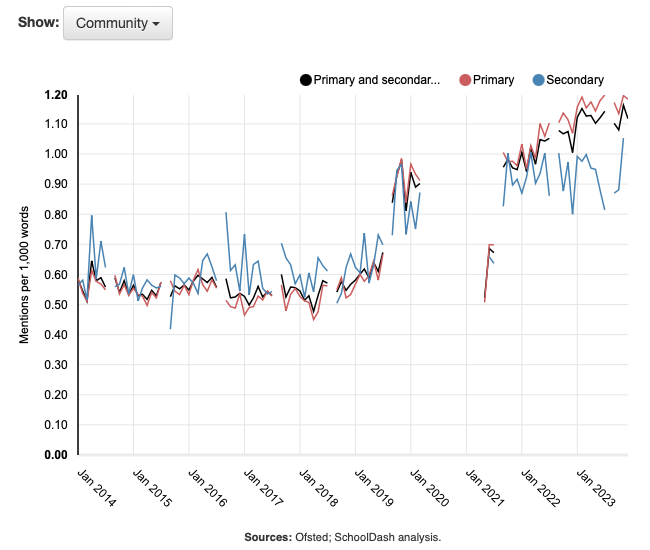
Ofsted obsessions and omissions
In recent times, Ofsted reports have increasingly mentioned "community":
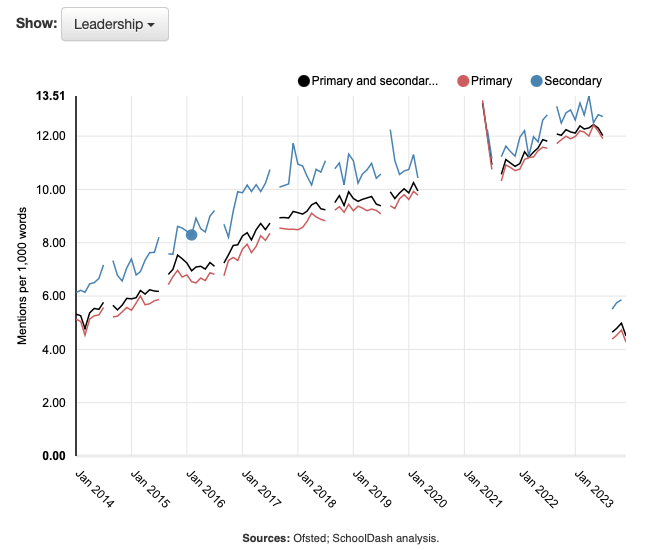
The same had been true of "leadership" – until very recently:
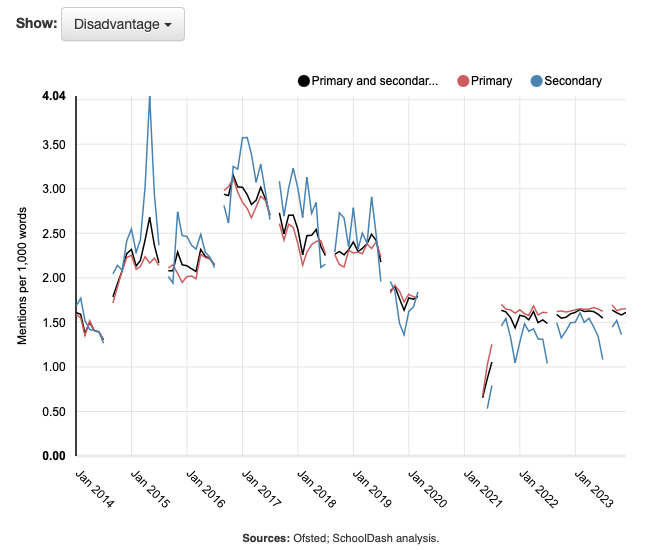
In contrast, mentions of "disadvantage" have been in long-term decline:
As have references to "teaching":
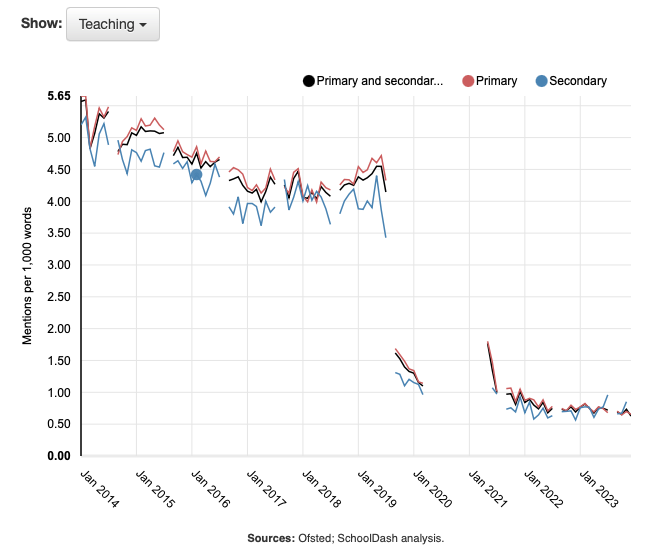
Members can see the latest trends in these and other terms in the SchoolDash Insights Ofsted section. Non-members can sign up for a free trial or write to us to find out more: [email protected].
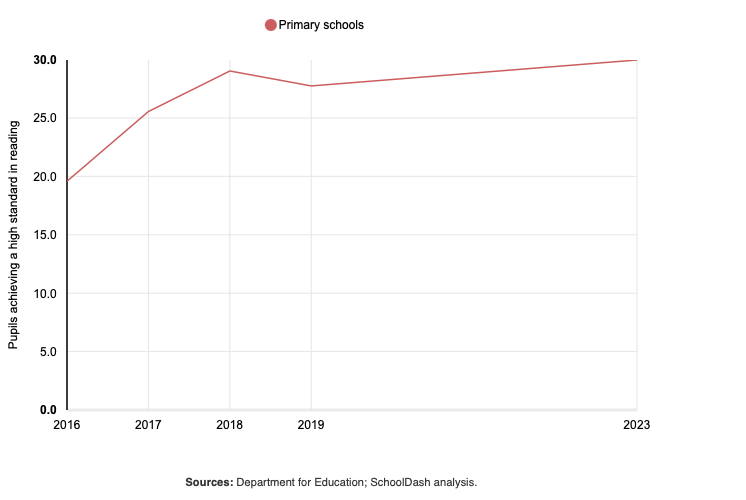
The unreasonable robustness of reading
Reading ability among 11-year-olds held up well through the pandemic:
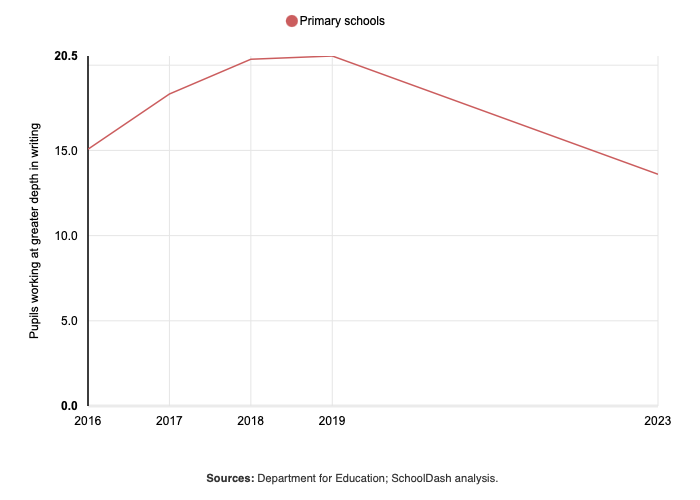
Unfortunately the same cannot be said for writing:
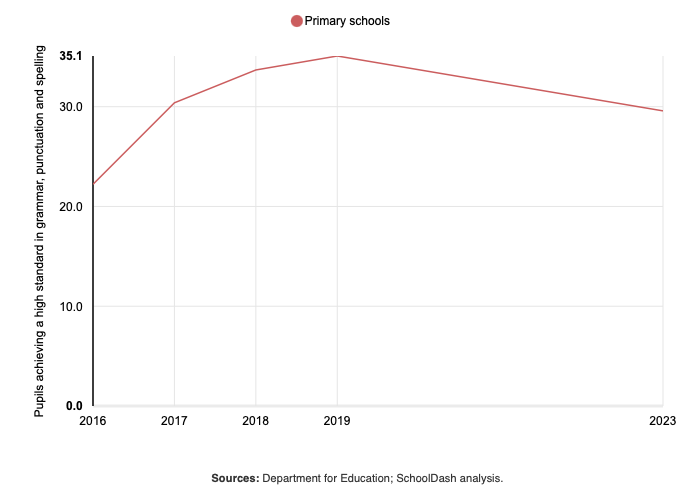
Or GPS (grammar, punctuation and spelling):
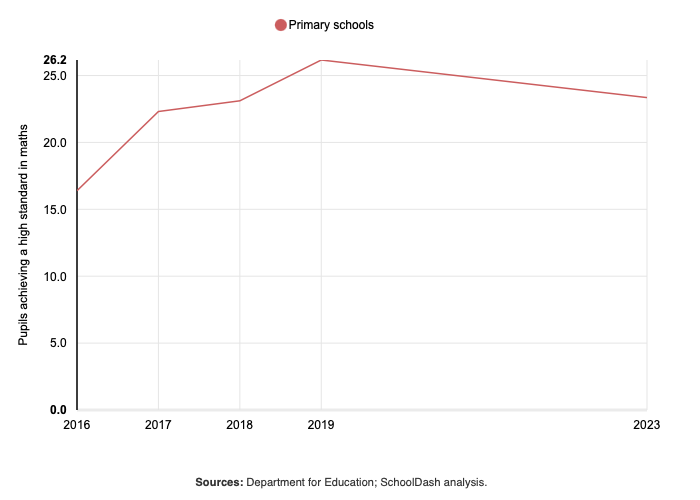
Or maths:
Members can find out more about this and other trends in the SchoolDash Insights Exams section. Non-members can sign up for a free trial or write to us to find out more: [email protected].
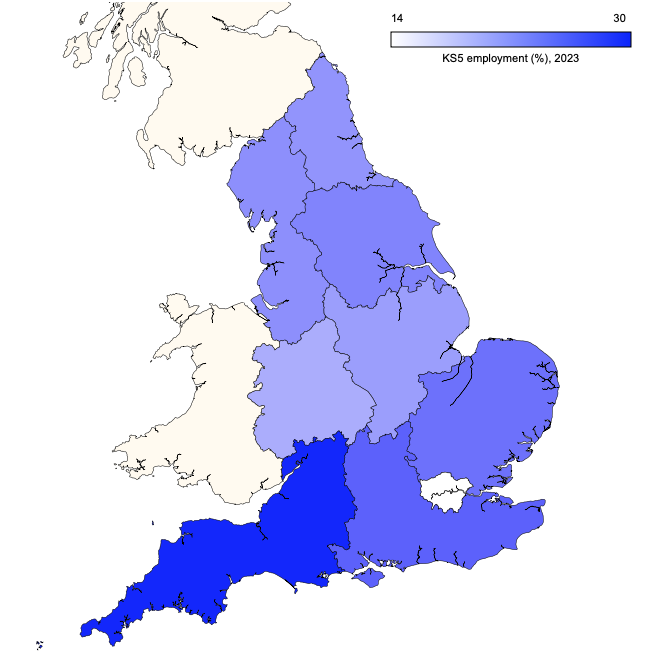
Employment rises
About 20% of KS5 students go into employment destinations. This is most common in the south outside London, especially in the South West:
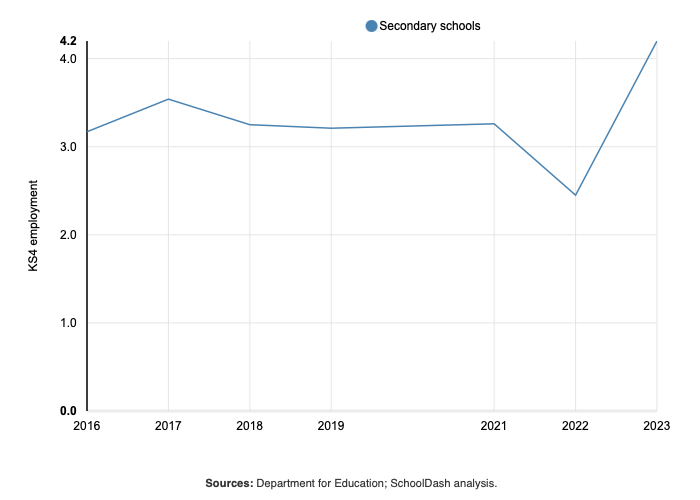
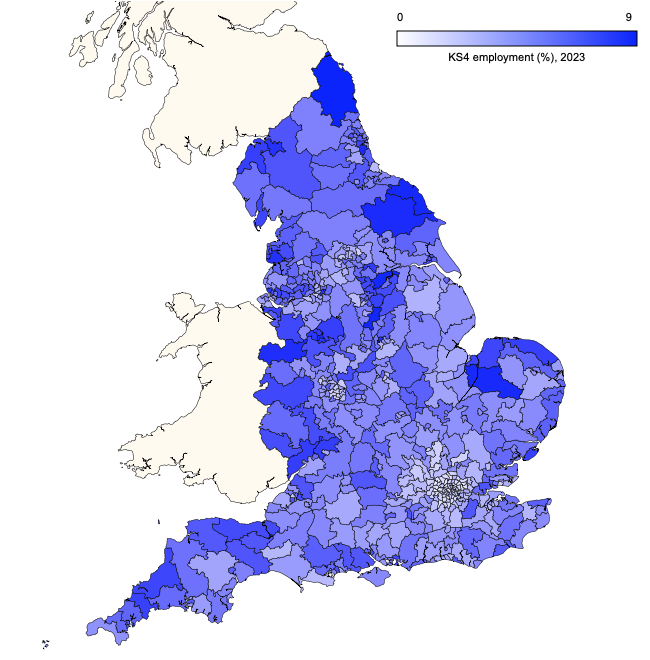
Only a very small proportion of KS4 students go into employment destinations, though this has risen since the pandemic:
It is much more common in some parts of the country than in others:
Members can find out more about this and other trends in the SchoolDash Insights Destinations section. Non-members can sign up for a free trial or write to us to find out more: [email protected].
Attainment asymmetry
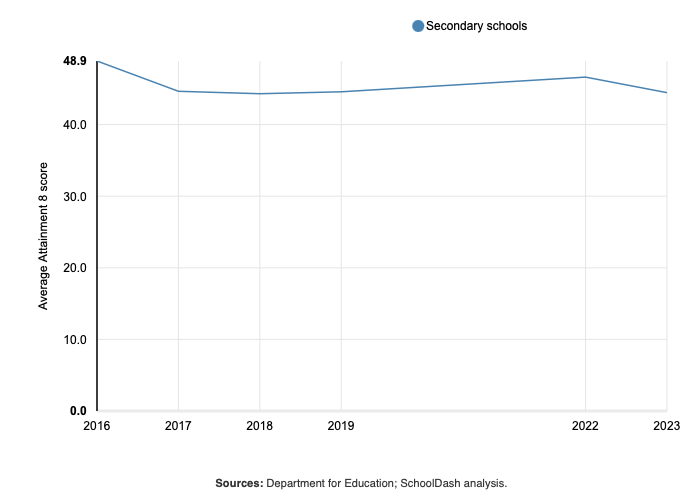
Attainment 8 scores declined in 2023, returning to roughly pre-pandemic levels:
But the difference between GCSE performance in London and the rest of England has, if anything, become even starker:
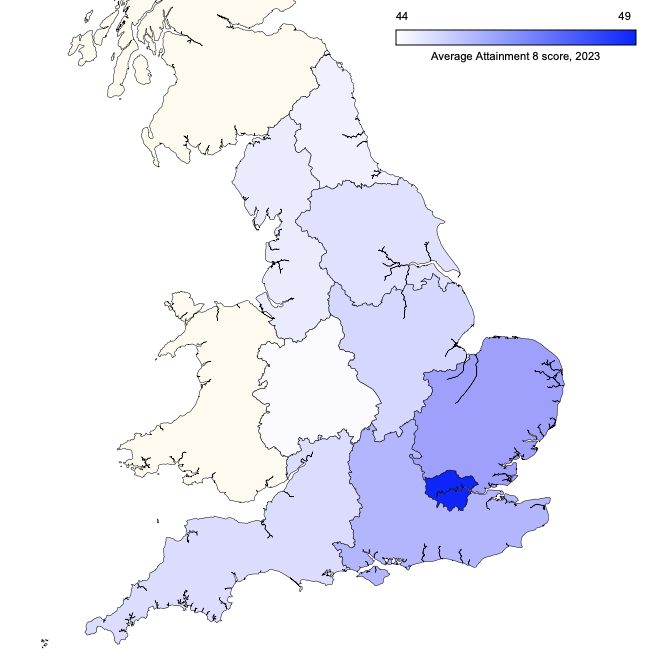
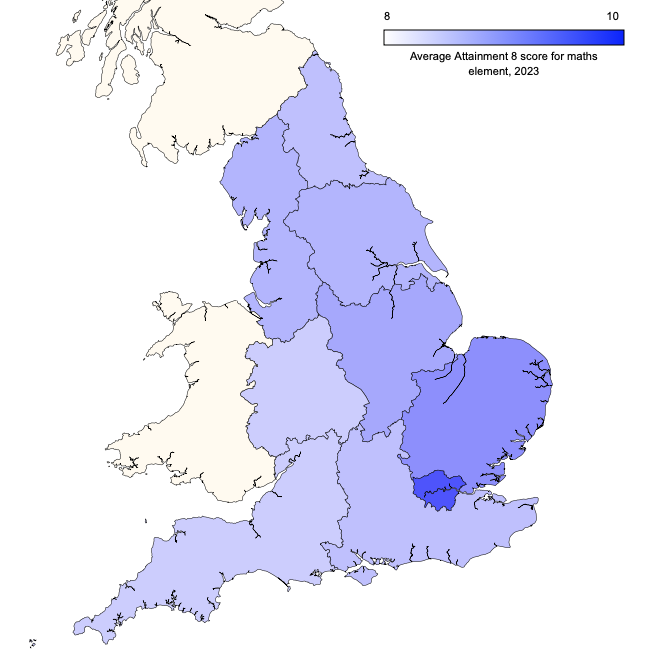
This appears to driven in part by maths performance:
Members can find out more about this and other trends in the SchoolDash Insights Exams section. Non-members can sign up for a free trial or write to us to find out more: [email protected].
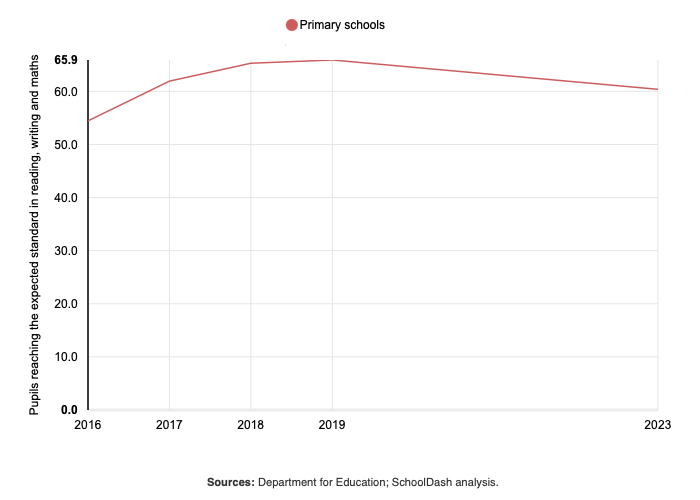
Post-pandemic primary pupils
The proportion of 11-years-olds achieving expected standards in reading, writing and maths has declined to below 2017 levels:
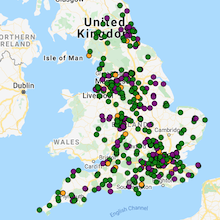
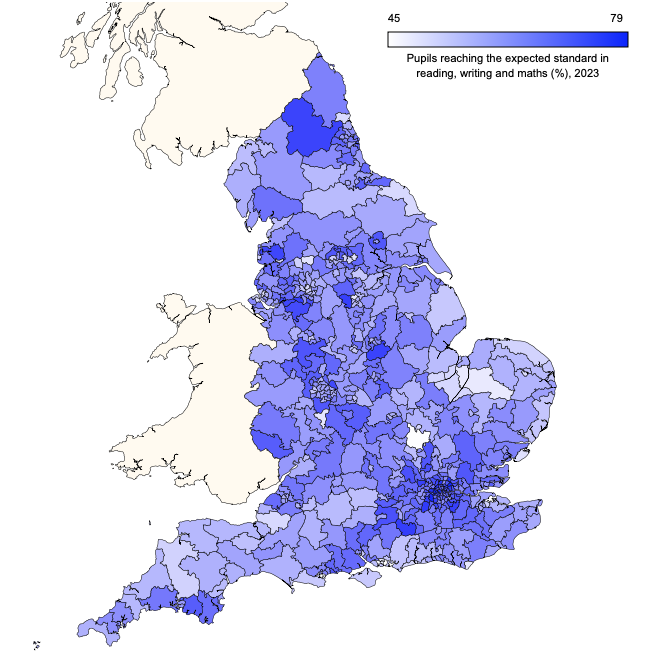
There is also a great deal of variation around the country:
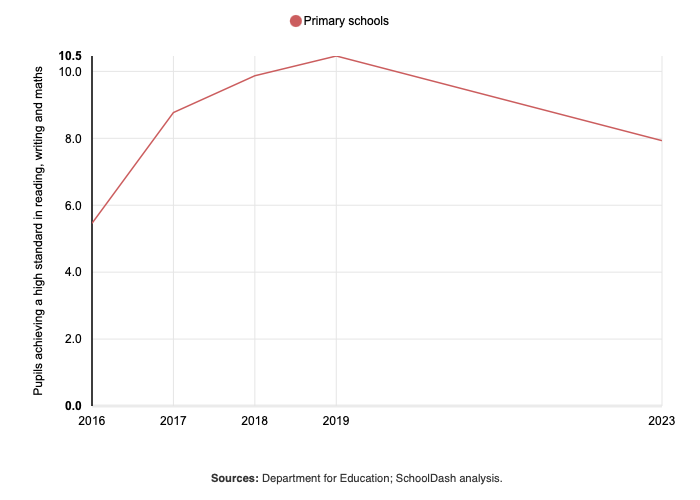
The proportion of 11-years-olds achieving high standards in reading, writing and maths has also declined to below 2017 levels:
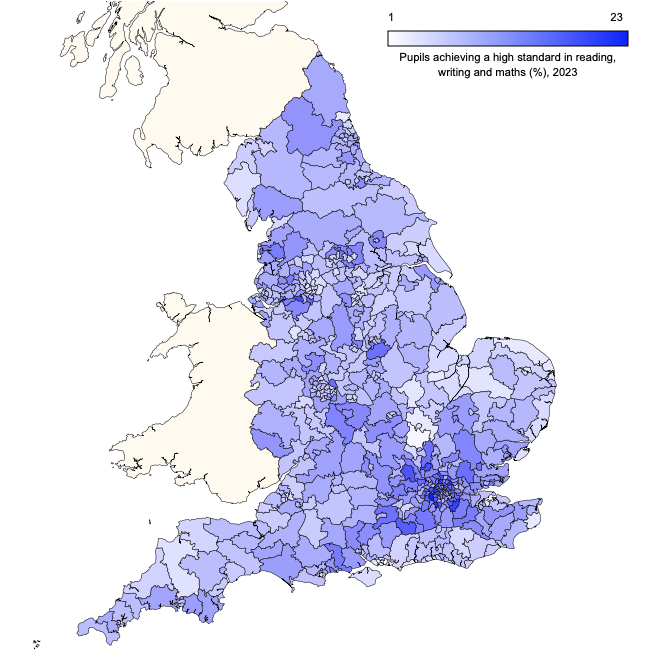
And the geographical disparities here are also huge:
Members can find out more about this and other trends in the SchoolDash Insights Exams section. Non-members can sign up for a free trial or write to us to find out more: [email protected].
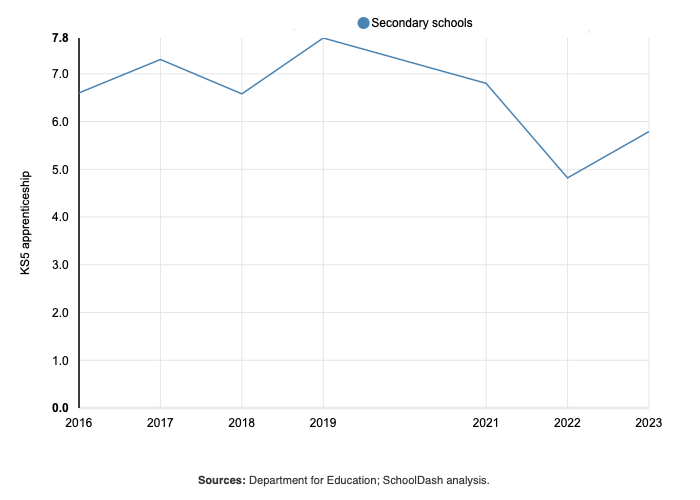
The apprentice
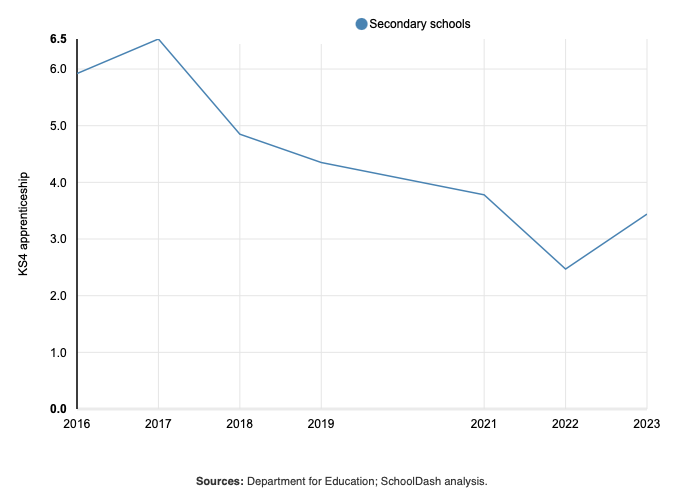
The proportion of 16-years-olds entering apprenticeships has roughly halved in the last six years:
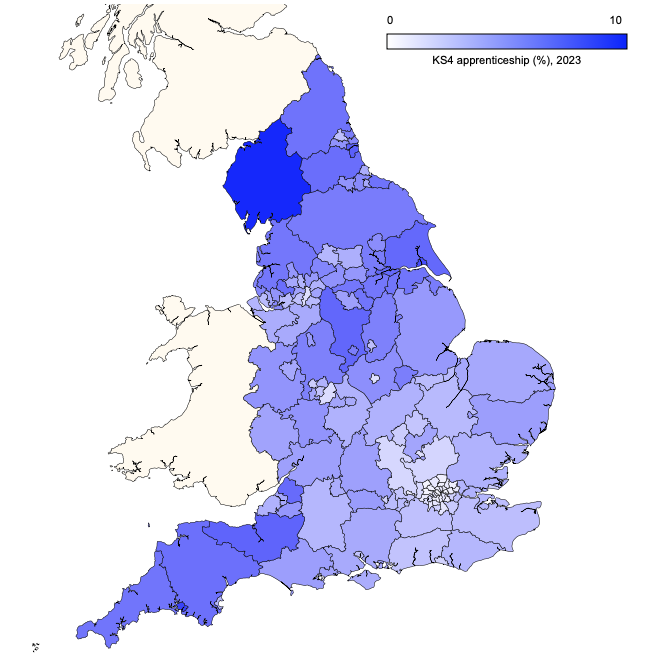
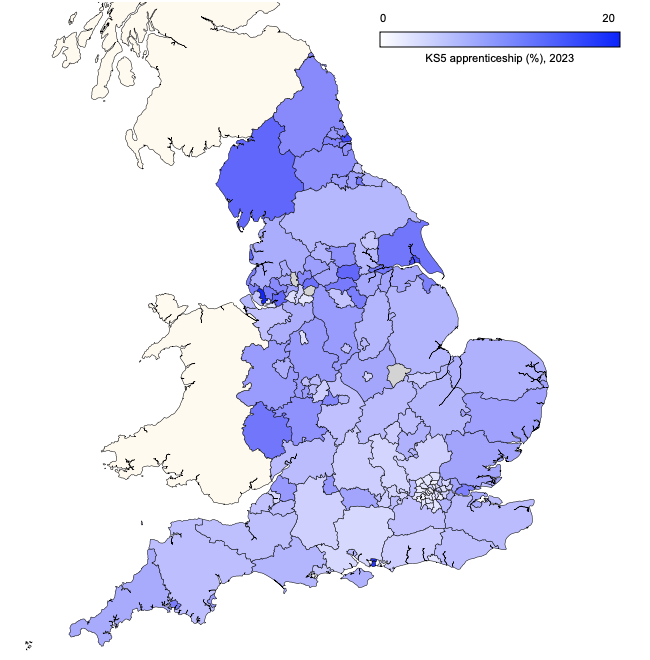
In 2023, the highest proportions were in the far North West and the South West. They were very low in London:
The proportion of 18-years-olds entering apprenticeships has also declined since the pandemic, but much less precipitously:
In 2023, the highest proportions of 18-year-olds entering apprenticeships were in the North and the West Midlands. As for 16-year-olds, they were very low in London:
Members can find out more about this and other trends in the SchoolDash Insights Destinations section. Non-members can sign up for a free trial or write to us to find out more: [email protected].
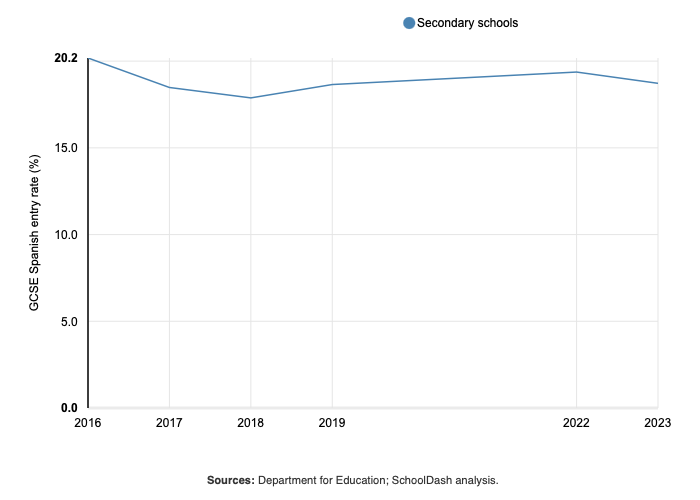
Non merci
The proportion of pupils taking GCSE Spanish has been relatively static at below 20%:
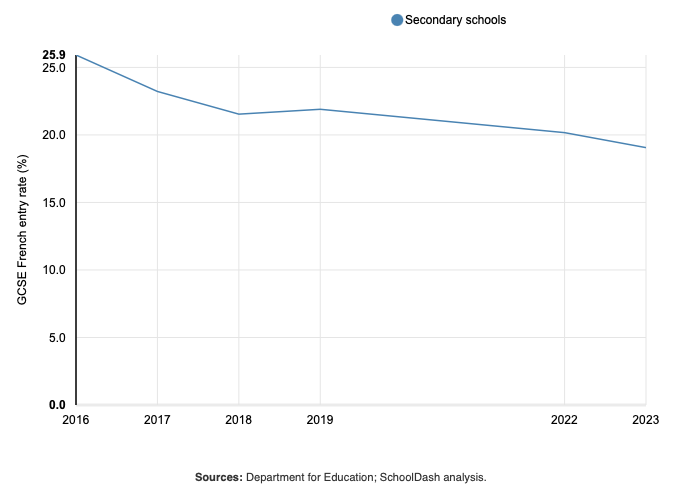
However, the proportion taking GCSE French has been in decline and it is now about as popular as Spanish:
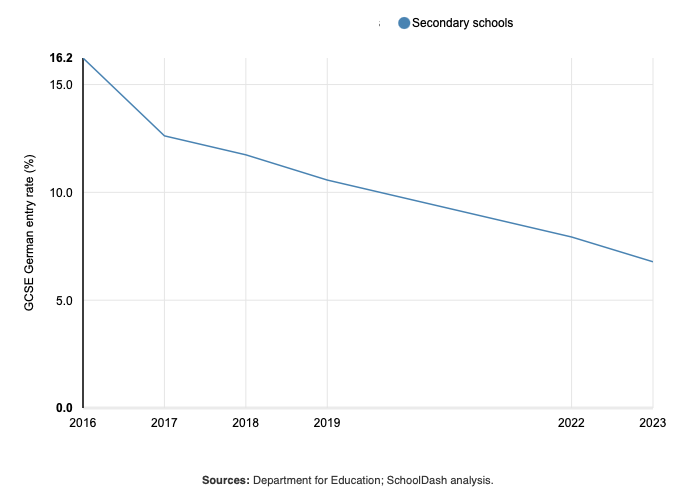
Entry rates for GCSE German have fallen even more steeply:
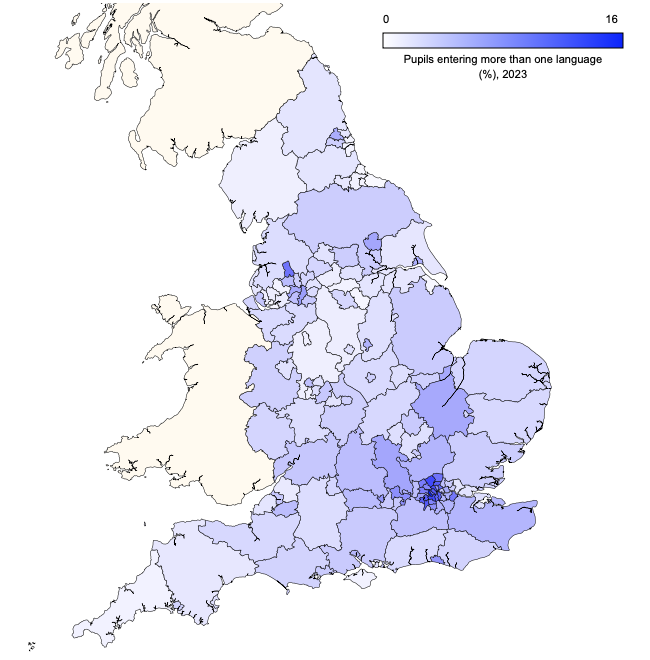
The proportion of pupils taking more than one langage at GCSE remains low at about 4%. They are particularly concentrated in parts of London:
Members can find out more about this and other trends in the SchoolDash Insights Exams section. Non-members can sign up for a free trial or write to us to find out more: [email protected].
A further educational divide
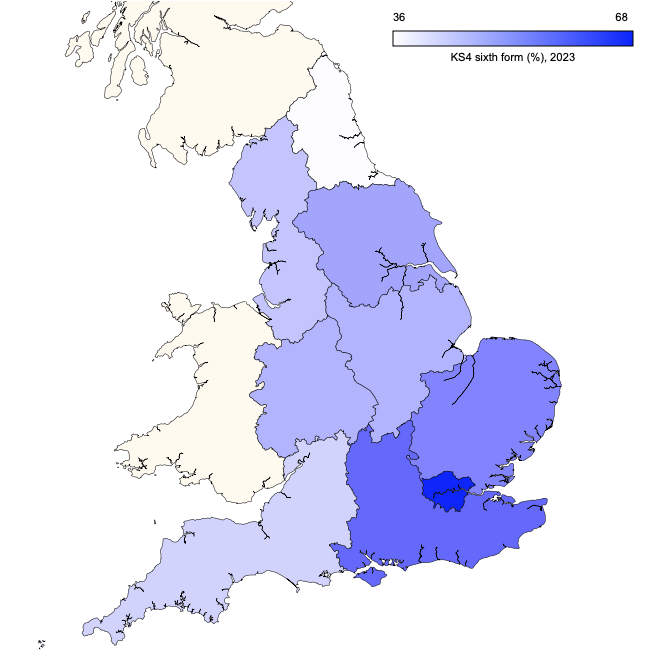
Around half of KS4 students go on to sixth form (either at their secondary school or elsewhere). The highest proportions are seen in London and the lowest ones in the North East:
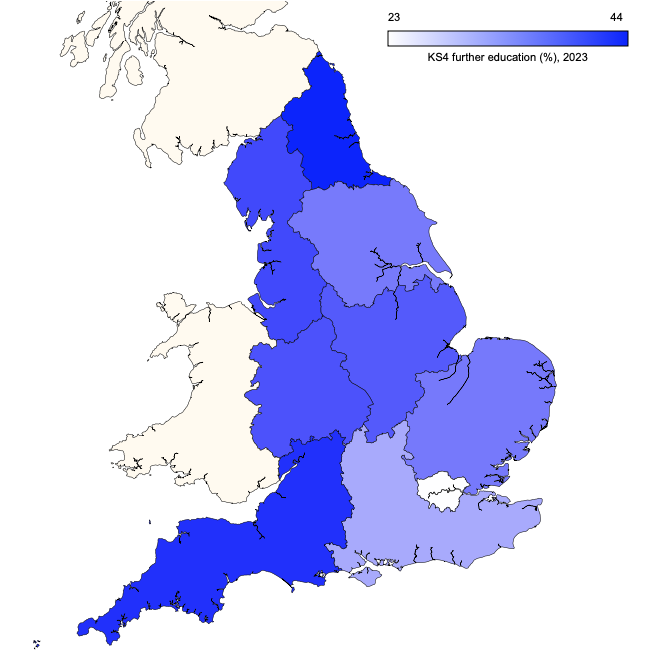
Just over a third of KS4 students go on to an FE college. This is much more common on the north and west of England, and less common in London and the South East:
Members can find out more about this and other trends in the SchoolDash Insights Destinations section. Non-members can sign up for a free trial or write to us to find out more: [email protected].
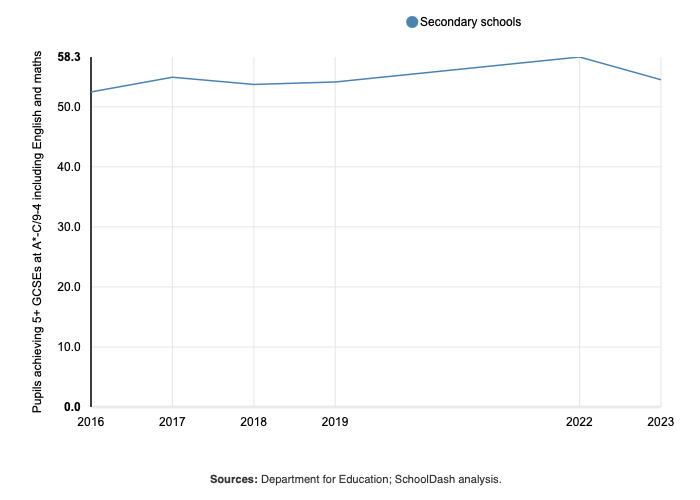
Five GCSEs good
The proportion of pupils getting 5 or more good GCSEs declined slightly in 2023, returning to pre-pandemic levels:
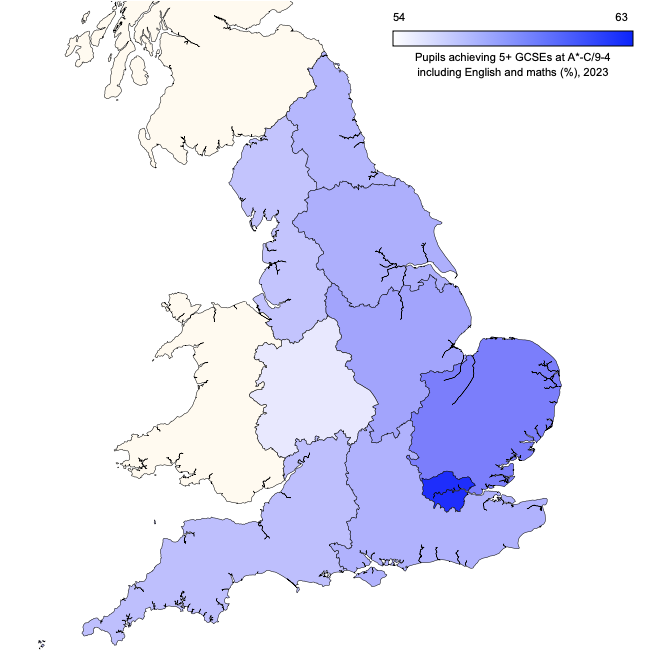
On this measure, London remains well ahead the rest of the country:
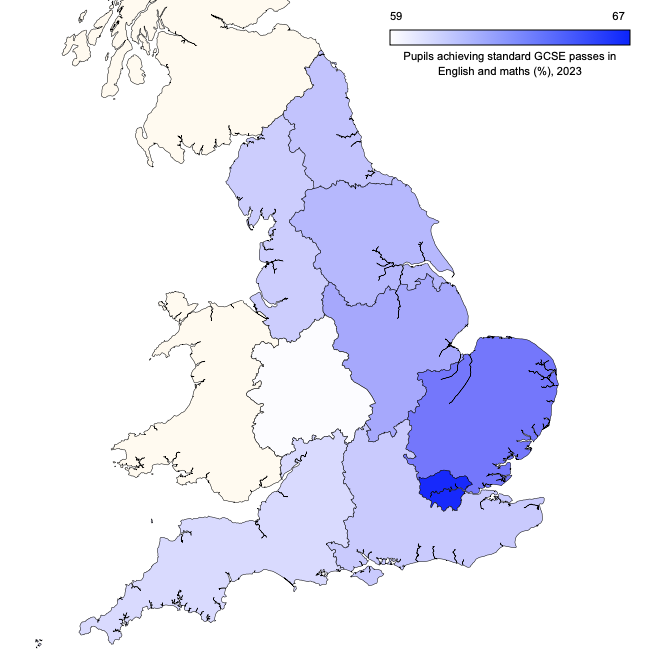
The same is true when looking just at English and maths GCSE results:
Members can find out more about this and other trends in the SchoolDash Insights Exams section. Non-members can sign up for a free trial or write to us to find out more: [email protected].
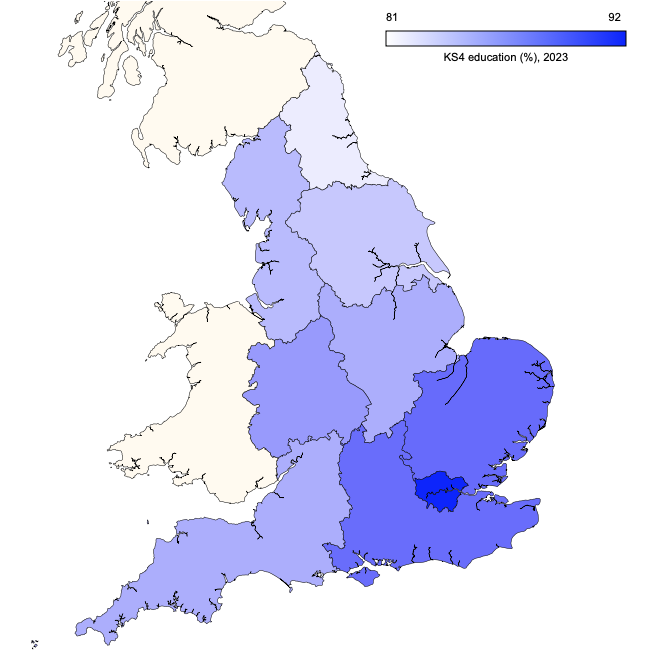
Destination education
Around 85% of KS4 students stay in education, but these proportions vary greatly across the country, with the highest numbers in London and the lowest ones in the North East:
In contrast, only about 60% of KS5 students stay in education, but once again there is a great deal of geographical variation. Here too, the proportions are highest in London and lowest in the North East:
Members can find out more about this and other trends in the SchoolDash Insights Destinations section. Non-members can sign up for a free trial or write to us to find out more: [email protected].
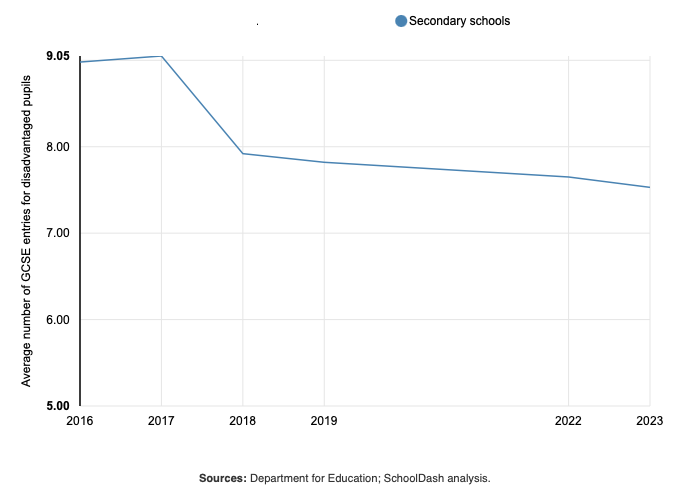
GSCE numbers
The average number of GCSEs taken by each pupil has been in decline over recent years, particularly (but not exclusively) among disadvantaged children. As shown below, there was a step reduction in 2018 (which coincided with extensive GCSE reforms such as the introduction of a 9-1 grading scheme for most subjects), but even since then the number has continued to fall:
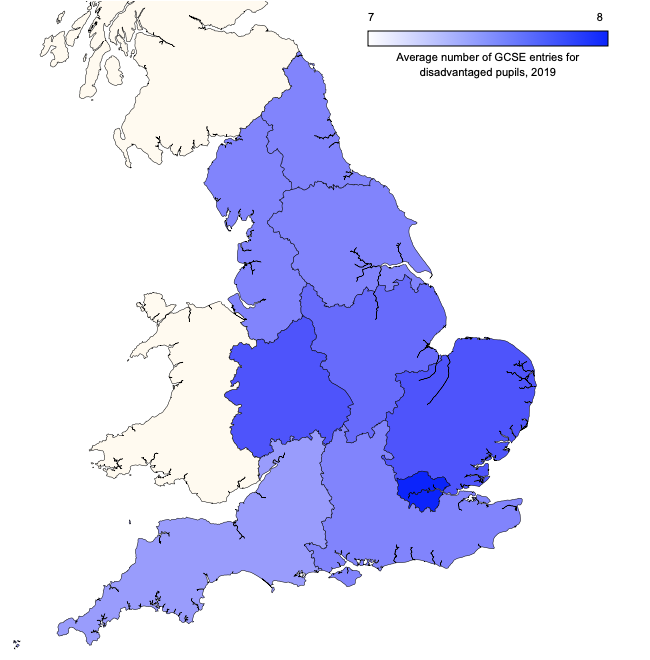
The average number of GCSEs per pupil also varies by region, and recent changes have exacerbated disparities between London and the rest of England. To see this, compare the situation in 2019:
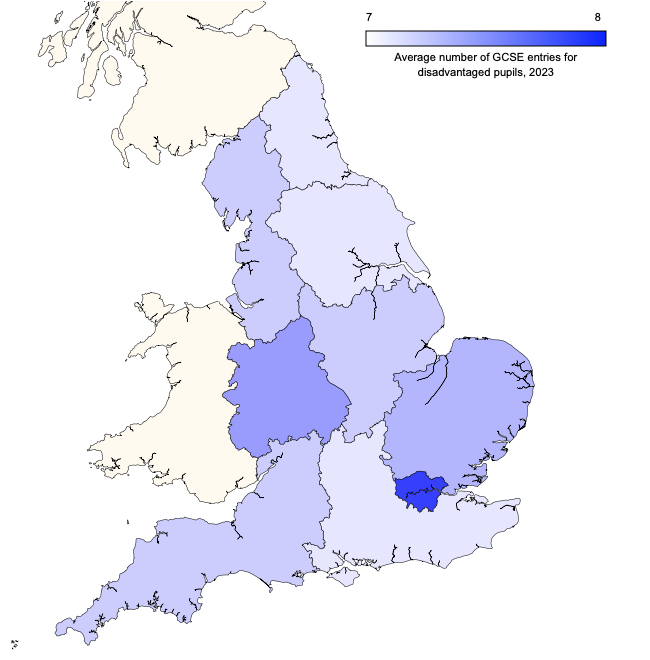
with that in 2023:
Members can find out more about this and other trends in the SchoolDash Insights Exams section. Non-members can sign up for a free trial or write to us to find out more: [email protected].
NEET handwringing
This is our first post looking at the latest DfE destinations data for Key Stage 4 and Key Stage 5. Others will follow in the coming weeks.
The proportions of students with no known educational or employment destination have been broadly flat in recent years at 6-7% of Key Stage 4 students and 10-15% of Key Stage 5 students. (Note that these include those with unknown destinations, not just those known to be NEET.)
But they remain much higher in some parts of the country than others. For example, the regional averages for Key Stage 4 in 2023 (which corresponds to the cohort that graduated from Year 11 in 2021) show clear north-south disparities, with the highest proportions in the North East and the lowest ones in London:
The same data for Key Stage 5 show somewhat similar patterns, though in the case the East Midlands shows the lowest rate and London is middling:
Note that in both cases similar maps by local authority area or parliamentary constituency show even greater variations within each region. For example, here are the Key Stage 4 data by parliamentary constituency, showing very specific NEET hotspots around the country:
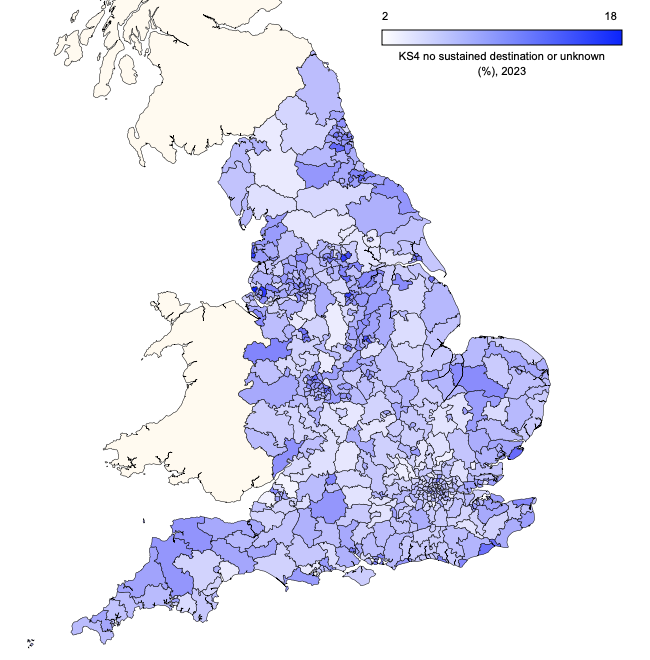
Members can find out more about this and other trends in the SchoolDash Insights Destinations section. Non-members can sign up for a free trial or write to us to find out more: [email protected].
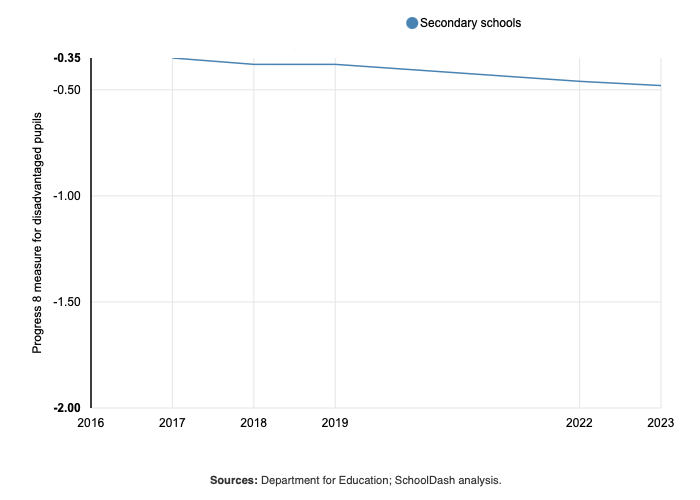
Post-pandemic Progress
In this and forthcoming posts, we'll be looking at selected findings from the recently released 2023 Key Stage 4 attainment and progress data – the first such school-level data release since before the COVID-19 pandemic.
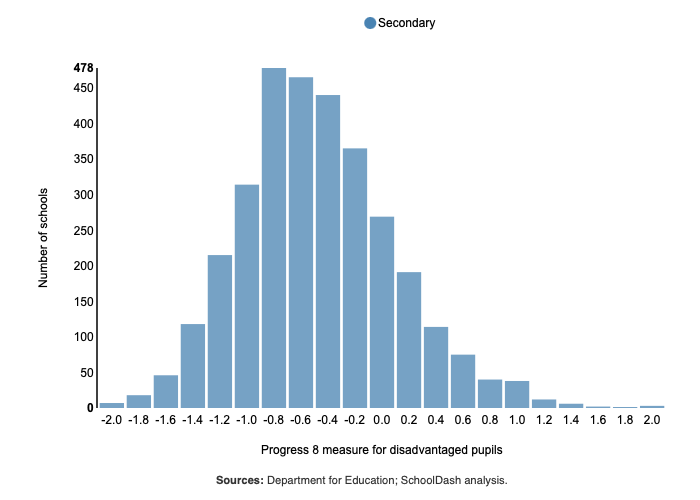
The Progress 8 measure for disadvantaged pupils has declined in recent years and the overall trajectory does not appear to have been affected by the pandemic:
Of course, the exact value can vary greatly by school:
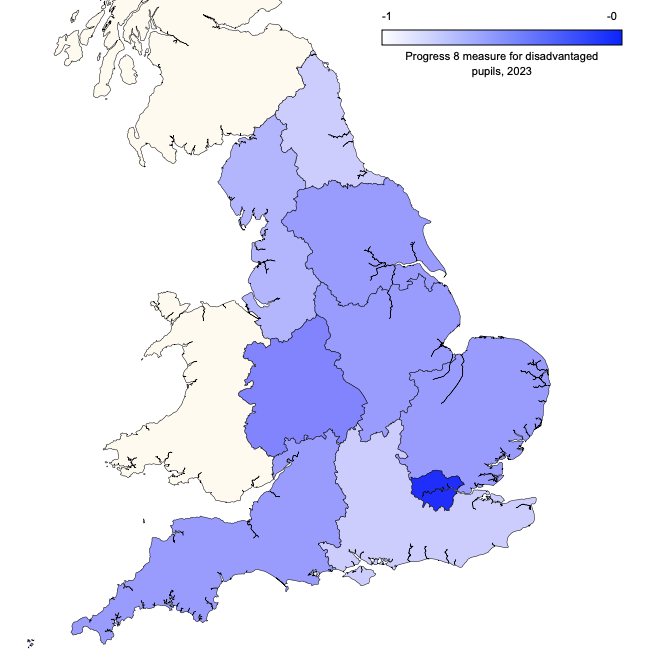
This overall decline appears to have exacerbated regional disparities, with London now even further ahead of the rest of country, at least in relative terms. Compare the regional averages in 2019:
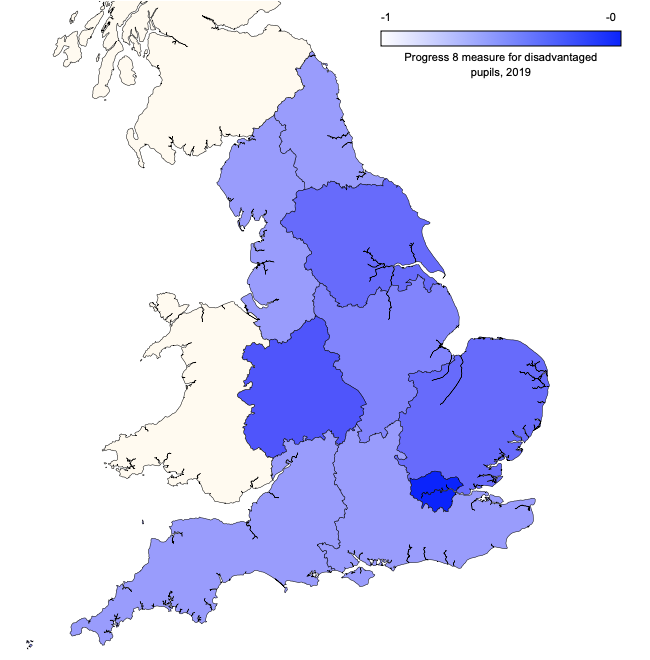
with those in 2023:
Members can find out more about this and other trends in the SchoolDash Insights Exams section. Non-members can sign up for a free trial or write to us to find out more: [email protected].