Earlier this month we looked at the differences in performance between state and private schools at both A-Level and GCSE. To simplify a longish and nuanced story, private schools tend to do better than state schools to the tune of about one grade per student per subject. However, private schools also start off, on average, with more able students. When we take into account their prior attainment by using 'value-added' scores instead of raw grades then at A-Level this difference drops to more like 0.1 of a grade per student per subject. In other words, about 90% of the difference in A-Level attainment appears to be explained by students' ability rather than educational effectiveness. (The DfE doesn't gather the necessary baseline data for private schools to enable the same analysis for GCSEs, though some recent academic research suggests a bigger gap there of 0.64 of a grade once prior attainment and other non-school factors have been taken into account.)
In addition, there was an intriguing hint (see Figure 10 of the A-Level analysis and the paragraph below it) that this state-private gap might vary systematically by subject. This post looks in more detail at that aspect. The results are interesting and, in places, rather surprising.
Figure 1, below, shows the over- or underperformance of private sixth-forms compared to state sixth-forms in 2014-151 for the most popular A-Level subjects2:
Figure 1: Difference in A-Level value-added score between private and state sixth-forms*
* Positive scores indicate higher average value-added in private sixth-forms.
** French, German and Spanish combined.
Sample sizes: State sixth-forms: 718-2,167. Private sixth-forms: 193-512.
Sources: Department for Education; SchoolDash analysis.
There are two striking things about this. First, the gap in almost every subject fell between 2014 and 2015, the only exception being History. Across all subjects, it went from 0.128 of a grade in 2014 to 0.114 in 2015. Proportionately that's quite a large change – about 11% – though with only two years' data it's impossible to say whether this is a trend or merely statistical noise.
Second, and even more interestingly, there is a great deal of consistency between the two years in the subjects that show large differences and those that display much smaller gaps. In particular, the differences in the sciences – including Maths and Economics – are almost negligible, averaging 0.03 of a grade in 2015. In contrast, the differences in what we might broadly refer to as the humanities – in this case, History, English Literature, Religious Studies, Psychology, Geography, Foreign Languages and Business Studies – are much larger, averaging almost 0.15 of a grade, or almost five times the difference seen in the sciences.
Why might this be? In my discussions with teachers and other educationalists, two explanations loom large. The most popular one is that analytical subjects fare better amidst the larger class sizes and more modest resources of state schools because it's possible to do well by studying the textbook and doing lots of practice questions, the answers to which are usually either right or wrong. In contrast, more discursive subjects suffer disproportionately in such environments because they require students to have the eloquence and self-confidence to make arguments on topics that are more matters of opinion than of fact. Such skills often come only with careful nurturing over a long period of time, benefiting from higher levels of teacher attention and extracurricular activities such as seminars and debates.
Another plausible explanation is that private schools do in fact create more able students in the sciences, but that this isn't reflected fully in their grades. Looking back at Figure 7 in the previous A-Level analysis, we can see that in Maths over 60% of students in private sixth-forms achieve an A or A* grade. The comparable metrics for History and English Literature are around 50%. When well over half of students are getting top grades there's obviously less room for improvement, with each progressive step getting harder as you asymptotically approach 100%. However, in this case Maths is an outlier – other scientific subjects are more similar to the figures quoted for the humanities – so I don't think this is likely to explain most of the difference.
Incidentally, it's interesting to note the positions of Economics and Psychology. Economics, as a social science, might be considered as lying somewhere between the natural sciences and the humanities, but in this context it clearly clusters with the former. In contrast, Psychology is often seen as a natural science (albeit at the 'softer' end of the spectrum), but in this analysis clearly comes out among humanities subjects. I'll leave it to others to comment on what, if anything, this might tell us about the nature of the subjects themselves. :)
Curiously, as shown in Figure 2, no similar pattern exists at AS:
Figure 2: Difference in AS value-added score between private and state sixth-forms*
* Positive scores indicate higher average performance in private sixth-forms.
** French, German and Spanish combined.
Sample sizes: State sixth-forms: 305-2,087. Private sixth-forms: 24-475.
Sources: Department for Education; SchoolDash analysis.
True, the state-private gap here reduced a bit between 2014 and 2015 (falling from 0.139 to 0.127 of a grade across all subjects), but there's no consistency between subjects, with some falling and others rising. Moreover, there's no clear science-humanities divide. In 2015 the smallest gaps were seen in Psychology, Geography, History and Biology, the largest ones in Foreign Languages, Business Studies, Chemistry and English Literature. This apparent randomness may be caused in part by the smaller sample sizes at AS, which could lead to more statistical noise, but I don't think that can account for all of the difference. (If you understand what's going on here then please do tell us.)
Figure 3 shows the distributions of 2015 AS and A-Level value-added scores for state and private sixth-forms. The horizontal axis shows the average value-added score for that qualification in each school, with the units representing fractions of a grade per pupil above or below the national average:
Figure 3: Distributions of A-Level and AS value-added by subject (2015)
* 'Foreign Languages' subject refers to French, German and Spanish combined.
Sample sizes: State sixth-forms: 718-2,167 for A-Level subjects; 305-2,087 for AS subjects.
Private sixth-forms: 193-512 for A-Level subjects; 24-475 for AS subjects.
Sources: Department for Education; SchoolDash analysis.
As you can see, the distributions are much more similar for A-Level Physics than for A-Level History, with other subjects falling in between these two extremes (use the drop-down menu to explore them). However, all subjects show considerable overlap, so knowing whether any given sixth-form is in the state or private sector doesn't on its own tell you very much about likely academic effectiveness.
In general, state sixth-forms predominate among institutions with low scores while private ones account for greater proportions of institutions with high scores, with the size of this effect obviously varying by subject. However, A-Level Physics, Chemistry and Maths show different patterns, with state sixth-forms predominating at both the low and high ends of the scale, and private ones showing a narrower range of effectiveness. This means that the relatively strong performance of state sixth-forms in these subjects is accounted for in part by a small number of very high-achieving institutions.
There are some remarkable facts here worth dwelling on. Consider the following: 95% of the top 100 institutions ranked by A-Level Physics value-added score are state-funded (even though state institutions account for only 82% of all those providing A-Level Physics). In addition, the top 10% of state sixth-forms in terms of A-Level Physics value-added outperform the top 10% of private sixth-forms by an average of 0.14 of a grade per student. (The effects for Maths and Chemistry are similar though smaller at 0.07 of a grade each. By comparison, English Literature and History show the opposite effect, with the top 10% of private sixth-forms doing better than the top 10% of state sixth-forms by 0.11 and 0.13 of a grade per student, respectively.)
The English Literature and History results seem unsurprising, but what's going on with Physics, Chemistry and Maths? Looking at the individual schools in more detail, there do seem to be a few anomalous cases – for example, state sixth-forms attached to schools that are in the midst of a turnaround programme, where a small number of students who may have previously underachieved at GCSE have gone on to outperform expectations at A-Level. But such situations seem to be the exception. Another possible reason is that if private schools perform strongly at GCSE then their students may have less scope to continue outperforming at A-Level. There is probably something to this, but as already discussed above it is only in Maths that we see signs of grade saturation (ie, well over half of students obtaining an A or A*). In any case, even if a previously mediocre student has more potential to progress, the school still has the difficult job of realising that potential and deserves credit when it does so. The bottom line is that in Physics, Maths and Chemistry there do indeed seem to be subsets of state sixth-forms that are achieving well above the norms of even the best private schools. It would be well worth understanding how they do this.
Choice subjects
Given the comparative advantage that private sixth-forms enjoy in the humanities, I wondered if this was reflected in the subject choices of their students. The answer, in a word, is no. Almost the opposite in fact. But before we get ahead of ourselves, let's provide some context by looking at the relative popularities of the most commonly chosen A-Level subjects. These are shown in Figure 4:
Figure 4: Popularity of A-Level subjects in state and private sixth-forms (2011-2015)
Source: Department for Education; SchoolDash analysis
The most popular subject overall is Maths, though it's considerably more popular at private sixth-forms (where it accounts for 13.9% of A-Level entries) than at state sixth-forms (9.5%). The second most popular subject, Psychology (were you as surprised as me?), shows the opposite pattern: it accounts for 7.7% of A-Level entries at state sixth-forms but only 3.5% at private sixth-forms. In general we see that the most popular subjects at private institutions tend to be traditional academic ones: Maths, Chemistry, Economics and Foreign Languages. At state sixth-forms relatively new-fangled subjects such as Psychology, Sociology and Media Studies are disproportionately popular, along with English Language and General Studies. Biology, History and English Literature are about equally popular in both the state and private sectors.
This overall pattern did not change very much between 2011 and 2015, though some notable developments can be seen. These include a rise in the popularity of Economics and Psychology, a net decline in Foreign Language entries and a collapse in General Studies. (Use the drop-down menu to view intervening years.)
Figure 5 shows differences between the state and private sectors in the popularity of these same subjects. Positive values (clustered on the right of the graph) indicate subjects that account for higher proportions of A-Level entries in private sixth-forms than in state sixth-forms; negative values (on the left) indicate subjects that are less popular in private sixth-forms than in state ones:
Figure 5: Difference in popularity of A-Level subjects at private and state sixth-forms* (2011-2015)
* Positive scores higher popularity in private sixth-forms compared to state sixth-forms.
** French, German and Spanish combined.
Sample sizes: State sixth-forms: 556-1,840. Private sixth-forms: 265-508.
Sources: Department for Education; SchoolDash analysis.
The pattern is reasonably consistent between 2011 and 2015 (use the drop-down menu to view intervening years). The main exception is General Studies, which has fallen in popularity in the state sector even faster than in the private sector, albeit from a much higher starting point, so its relative unpopularity in private sixth-forms has reduced.
Note the surprising mismatch between Figure 1 and Figure 5. The former shows that students at private sixth-forms tend to do best in subjects such as English Literature, History and Psychology, yet the latter shows that they are less likely to choose those very subjects. (Note that we didn't analyse the differences in performance for Sociology, English Language, Media Studies and General Studies because there were insufficient private students to provide a reliable comparison.) At the other end of the scale, the sciences, including Maths and Economics, are particularly popular at private sixth-forms, yet these are precisely the subjects at which those institutions fail to distinguish themselves relative to the state sector. The one area in which private sixth-forms seem to both attract larger proportions of students and outperform the state sector is in Foreign Languages.
At first sight this discrepancy seems perverse, but it's possible to imagine rational reasons for it. For example, if private sixth-forms tend (deliberately or otherwise) to encourage study of the sciences then they might end up with larger proportions of less enthusiastic students taking those subjects. Conversely, those students who buck the trend by choosing humanities subjects are presumably more likely to be highly motivated and to outperform expectations. This is consistent with views I've heard from current and former teachers, who tell me anecdotally that (a) state sixth-forms can be stricter in deciding which students are permitted to take science subjects, and that (b) private sixth-forms can make science more attractive to students who are less naturally drawn to them as a result of the richer experiences they offer at secondary school. You be the judge, but note that none of this explains the differences seen in Modern Languages, where private sixth-forms really do seem to be achieving more in terms of both popularity and attainment.
We need to take care not to jump to the conclusion from these data alone that private sixth-forms cause more students to choose the sciences and languages at A-Level – it may simply be that the kinds of students they attract are inclined to do so already. But on the face of it, if you want to encourage your child into the sciences then sending them to a private sixth-form might be a good idea. However, if they're already hooked then they're likely to do just as well at a state institution. The exact opposite is true in the humanities. If, on the other hand, languages are really your – or their – thing then considering a private education may be worthwhile from both points of view: your son or daughter would be somewhat more likely to continue their studies and also eventually to do well. C'est la vie.
Footnotes:
There are no publicly available data for years before 2014.
Sociology, English Language, Media Studies and General Studies are also popular at state sixth-forms (see Figure 4), but students taking these subjects at private sixth-forms are too few to enable a reliable comparison so they have been omitted from this analysis. Note also that French, German and Spanish on their own would not qualify as particularly popular A-Level subjects, but they do in aggregate, which is how we are treating them here.
Having looked at A-Level results in the accompanying post, we're now going a take a deep breath and plunge into realm of of GCSEs. Be warned: the data here are murkier and the conclusions less, well, conclusive. But I think they're interesting all the same.
One country, two systems
It turns out to be difficult to assess GCSE results across all schools, mainly because a lot private schools use unaccredited versions of the International GCSE (IGCSE), which the DfE started phasing out from its exam results data in 2013. State schools don't have this choice, so at least we have full visibility there. (For more information, see this helpful overview and this 2015 press coverage.) Hopefully one day we'll return to a situation in which we can compare like with like, but for the time being we're stuck with two different approaches to GCSE, only one of which is visible to us. As a result, we have only a partial view of academic attainment in private schools.
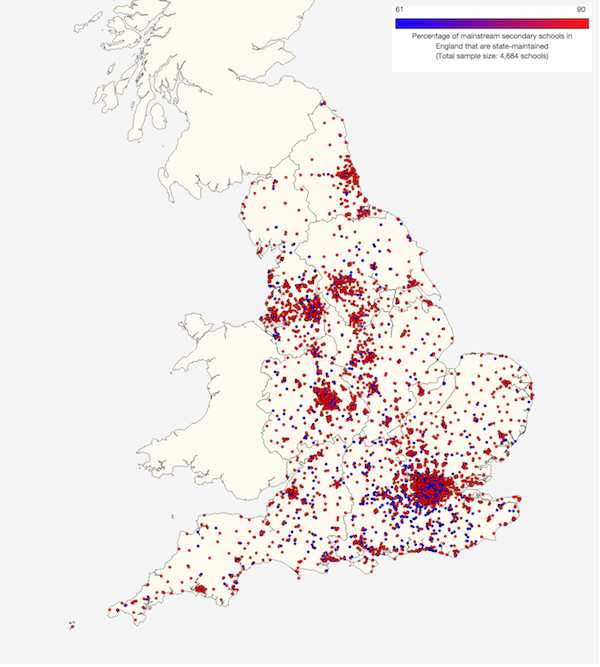
At the time of writing there are 3,423 mainstream state secondary schools in England and 1,261 similar private schools (making a 73% / 27% split in school numbers). Map 1 shows their locations, with state schools in red and private schools in blue (click on the map to go to a larger interactive version):
Map 1: Locations of state (red) and private (blue) secondary schools in England
Most of the numbers quoted below for private schools use data from subsets of between a third and two-thirds of the full set of 1,261 schools. Exactly how many depends on the proportion for which data are available for any given analysis (for more specific information, see the individual sample sizes quoted). On the whole I'm going to assume that these are representative of all private schools in England, though of course in some ways they're obviously not because they're typically the ones using either accredited IGCSEs or 'normal' GCSEs1. Ultimately it's impossible to be sure how representative or not these particular private schools might be, so all we can do is to keep this in mind as a potential complicating factor.
Kids and cash
Next let's a look at what we can glean about the characteristics of these schools and the pupils who attend them. As shown in Figure 1 (and as we saw for A-Levels), private schools are much smaller than state schools, having on average fewer than half the total number of pupils. Even more strikingly, their average cohort sizes are less than a third of those at state schools:
Figure 1: Average numbers of pupils per school (2015)
Sample sizes: State schools: 3,068-3,187. Private schools: 840.
Sources: Department for Education; SchoolDash analysis.
The difference in cohort sizes between state and private schools is even bigger than the difference in total pupil numbers because private schools are more likely to cover both primary and secondary phases of education. The average lower age among private schools with a secondary phase is 6.3 years versus 10.7 years in state schools. The corresponding figures for average upper age limit are 16.8 year in private schools compared to 17.8 years in state schools, indicating that the latter are more likely to have a sixth form.
The numbers of pupils at mainstream private schools who are from disadvantaged backgrounds are hard to assess because the kind of data normally used (such as eligibility for free school meals) is not available, but they surely make up a low proportion. As with the A-Level analysis, we can get an indirect sense of this by looking at where they are located, particularly in relation to geographical measures of socioeconomic deprivation.
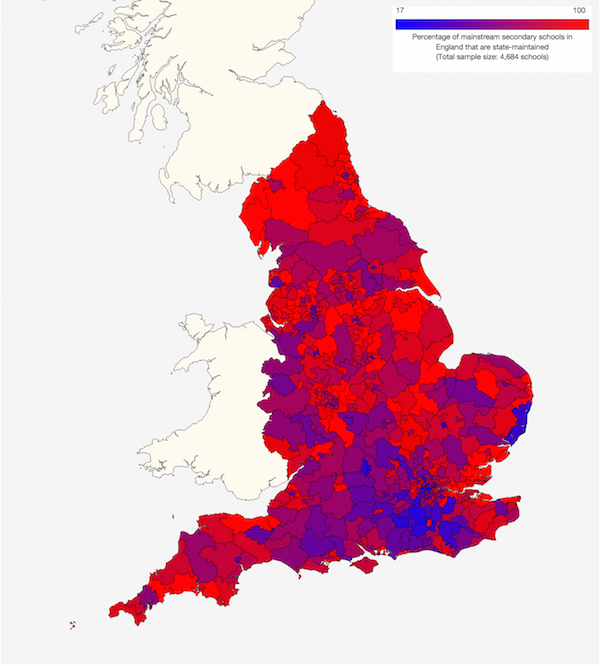
Map 2 shows the proportions of secondary schools that are state funded for each parliamentary constituency in England. Unsurprisingly, areas with the lowest proportions of state schools (ie, the highest proportions of private schools, shown in blue) tend to be relatively well-off ones such as those to the south and west of London:
Map 2: Proportions of secondary schools in each English parliamentary constituency that are state funded
More analytically, we can use the IDACI ('Income Deprivation Affecting Children Index') measure issued by the Department for Communities and Local Government to quantify the level of deprivation experienced by children in the neighbourhood of each school. This is not perfect because the pupils themselves may come from other neighbourhoods, which could be poorer or more affluent, but it's a reasonable indicative guide. Figure 2 shows that compared to state schools (which have an average local IDACI of 0.180), private schools are indeed much more likely to be located in wealthier neighbourhoods (average IDACI of 0.138), though not overwhelmingly so:
Figure 2: Deprivation index of school postcodes (2015)
Sample sizes: State schools: 3,418. Private schools: 1,261.
Sources: Department for Education; Department for Communities and Local Government; SchoolDash analysis.
Data on the proportions of pupils with special educational needs (SEN) are easier to come by and on the face of it these children are actually slightly more prevalent at private schools. An average of 12.8% of private-school pupils receive SEN support compared to 12.7% of state school pupils; and an average of 2.7% of private-school pupils have a SEN statement or EHC plan (indicating a higher level of need – see here for an explanation) compared to an average of just 1.9% at state schools. However, as we saw with sixth-form colleges, these averages are slightly misleading because once again the numbers for private schools are boosted by a few small establishments with very high proportions of SEN pupils2. As shown in Figure 3, most private schools actually have lower proportions of pupils receiving SEN support, though some (represented by the blue bars on the right of the figure) have unusually high numbers. The same is true for pupils with SEN statements or EHC plans:
Figure 3: Pupils with special educational needs (2015)
Sample sizes: State schools: 3,229. Private schools: 1,233.
Sources: Department for Education; SchoolDash analysis.
As you might expect, private schools have more money too. The average annual grant income for mainstream secondary schools in England is about £5,800 per pupil. In contrast, annual day fees at private schools average about £15,600 a year3, and difference of about 2.7-fold. (Boarding fees are the in the region of £27,000 a year4.)
Last but not least, private schools are much more likely to select pupils based on academic ability. Selective state schools (ie, grammar schools) account for less than 5% of all mainstream secondary schools in England. In contrast, DfE data show around 11% of private schools that are known to be selective compared to about 29% that are known to be non-selective. The status of the remaining 60% is unclear, but if we assume that they show a similar split to the 40% for which we have data then we can estimate that around a quarter of private schools are selective, which is more than five times the proportion in the state sector. Of course, none of this says anything about the degree of selectivity exercised by each school. Determining that is a whole project on its own, so important though it is we'll gloss over it here.
Five GCSEs good
Given their advantages – more money and fewer, mostly brighter pupils – private schools ought to achieve better academic result than state schools. Sure enough, they are more successful on almost any measure you care to look at. Figure 4, shows the average proportions of pupils achieving five good (grade A*-C) GCSEs including English and maths. In 2015 the difference was around 10 percentage points – 68% versus 58%:
Figure 4: Proportions of pupils getting five good GCSEs (2012-2015)
Sample sizes: State schools: 2,784-3,064. Private schools: 237-717.
Sources: Department for Education; SchoolDash analysis.
There are two very important things to understand in interpreting Figure 4. First, all (private) schools reporting a 0% score have been omitted from the calculated averages. These schools are assumed to be using IGCSEs that don't appear in the DfE statistics rather than genuinely getting none of their pupils to five good GCSEs. Second, any school reporting a non-zero score is included. This would tend to understate the performance of any (again, private) schools that use a mixture of unaccredited IGCSEs and accredited IGCSEs or GCSES. Looking through the data, it's clear that there are at least some examples of schools that showed very strong performance before 2013 and have slipped substantially since then. This is almost certainly a statistical artefact linked to use of IGCSEs. The overall effect is to underestimate the performance of private schools, so the gap mentioned above is probably even larger in reality. One (admittedly imperfect) way to gauge this effect is to compare the 2015 averages with those from 2012 – ie, before the problem of IGCSE omissions arose. The gap then was 17 percentage points.
Whatever the exact size of the gap, some of it could be explained by different proportions of boys and girls in each type of school since we know that girls tend to do better at GCSE. However, the average proportion of girls in state secondary schools (49.2%) is in fact slightly higher than in private secondary schools (48.2%). And in any case the differences between state and private schools are comparable for both boys and girls.
Before reading too much into these average figures, however, we should also look at the distributions of scores for state and private schools. As Figure 5 shows, these turn out to be informative too:
Figure 5: Proportions of pupils getting five good GCSEs (2012-2015)
Sample sizes: State schools: 2,784-3,064. Private schools: 237-717.
Sources: Department for Education; SchoolDash analysis.
As you can see, on the standard measure of 'five good GCSEs including English and maths' the distributions overlap, so some state schools do better than some private schools. But they are also quite distinct, so the higher performance of private schools isn't just caused by a few high-flying establishments. This is reasonably consistent between between boys and girls, and from 2014 to 2015, but as with the average scores in Figure 4, the differences between state and private schools were even starker back in 2012 and 2013, with very large proportions of private schools taking almost all of their pupils to at least five good GCSEs. Similar trends also apply to GCSE measures that either exclude equivalent qualifications or relax the requirement for English and maths.
Another interesting aspect of the distributions is that that are often bimodal – ie, there are two peaks. Looking at the 2015 data, for example, state schools show a big peak in the middle and small peak of high-performing schools on the right. It's no coincidence that the small peak represents about 5% of state secondary schools: these correspond almost perfectly with the subset of grammar schools. Private schools, in contrast show a big peak on the right and small one on the left. The smaller peak was absent in 2012, appearing in 2013 and then getting bigger in 2014 and 2015. This coincides with the DfE's phasing out of unaccredited IGCSE results, so I interpret this peak as consisting mainly of schools that use a mix of accredited and unaccredited exams, resulting in a lower performance on this measure than they would otherwise achieve. This observation also gives us a sense of the size of this effect, which is not huge but is definitely significant.
Scoring points
Of course, getting five good GCSEs isn't the only measure of academic attainment. Another one for which some data are available across both state and private schools is the GCSE 'point score'. This has the advantage of being a continuous measure (ie, it covers a wide range of attainment levels), unlike the 'five good GCSEs' metric, which is a threshold measure (ie, it only records whether each pupil made the grade, not how far above or below it they came). To give you an idea of the DfE's GCSE grade scoring system, five grade-Cs gets 200 points (40 points each) and 10 grade-A*s gets 580 points (58 points each). For a more detailed explanation see this DfE document.
There are two ways of looking at point scores: average points per subject and total points across all subjects. We'll look at each of these in turn. As you can see in Figure 6, private schools show higher average grades per GCSE subject and it makes virtually no difference whether we include or exclude equivalent qualifications. The difference in average between about 39 points and about 45 points is roughly the difference between a grade B and a grade C, give or take a point:
Figure 6: Average GCSE point scores per subject (2015)
Sample sizes: State schools: 3,066. Private schools: 774-775.
Sources: Department for Education; SchoolDash analysis.
Figure 7 shows the distributions of point scores, both including and excluding equivalent qualifications. Once again, the state and private school distributions overlap but are quite distinct:
Figure 7: Average GCSE point scores per subject (2015)
Sample sizes: State schools: 3,066. Private schools: 774-775.
Sources: Department for Education; SchoolDash analysis.
The small number of private schools with very low average scores per subject (on the left-hand side of Figure 7) seem on inspection to be composed mainly of atypical establishments best thought of as special schools, though they are not labelled as such in the DfE data.
It's also possible to look at GCSE grades by subject. The most common pattern here is for private schools to show a peak one grade higher than state schools – very similar to what we saw for A-Levels. However, there are some subjects in which state schools came a bit closer to matching the performance of private schools. In 2015 these were English Language, English Literature and Science. Yet there were also subjects in which state schools seemed to perform particularly badly in comparison to their private peers, namely Computing, French, Geography, Religious Studies and Spanish:
Figure 8: Distributions of GCSE grades by subject (2015)
Sample sizes: State schools: 32,254 to 543,415 entries per subject.
Private schools: 1,191 to 21,110 entries per subject.
Sources: Department for Education; SchoolDash analysis.
Let's now look at total points scores across all subjects. This measures not only levels of attainment but also numbers of subjects – quantity as well as quality. As shown in Figure 9, state schools actually seem to do better than private schools on this measure, and this holds whether we look at total point scores, capped point scores (which include only each pupil's best 8 subjects), GCSEs-only point scores (where other equivalent qualifications don't count). It also applies to both boys (all qualifications | GCSEs only) and girls (all qualifications | GCSEs only). To help calibrate, the average capped total points score for state schools of 316 is just shy of 8 grade-C GCSEs:
Figure 9: Average total GCSE point scores (2015)
Sample sizes: State schools: 2,836-3,066. Private schools: 455-775.
Sources: Department for Education; SchoolDash analysis.
Of course, we must recall that, due to the omission of some IGCSEs from the data, not all subjects will be represented for all private-school pupils, so their scores will be underreported. We can see this more clearly in the distribution of total points scores shown in Figure 10:
Figure 10: Average total GCSE point scores (2015)
Sample sizes: State schools: 2,836-3,066. Private schools: 455-775.
Sources: Department for Education; SchoolDash analysis.
The left-hand bulge of private schools with low total point scores per pupils is presumably composed at least in part of schools that use a mixture of accredited and unaccredited exams. Nevertheless, given that many private schools do use accredited exams, I'm rather surprised not to see more of them making an appearance among the high scores on the right-hand side of the graph.
Unsurprisingly, private schools show fewer (DfE-accredited) subject entries per pupil, as shown in Figure 11. This applies whether we include or exclude equivalent qualifications:
Figure 11: Average numbers of subject entries per pupil (2015)
Sample sizes: State schools: 3,066. Private schools: 773.
Sources: Department for Education; SchoolDash analysis.
Figure 12 shows even more clearly the apparent effect of omitted unaccredited IGCSEs, with a large proportion of private schools showing half or fewer subject entries per pupils than you much usually expect at a reasonably academic school, and very few showing more than 10 subject entries per pupil. Again, the picture is broadly similar if we include or exclude equivalent qualifications:
Figure 12: Average total GCSE point scores (2015)
Sample sizes: State schools: 3,066. Private schools: 773.
Sources: Department for Education; SchoolDash analysis.
What value?
A very important issue to bear in mind is that none of these measures take into account pupils' prior attainment. Given that their intake is generally more selective and more affluent, private schools start with an advantage even before we consider their bigger bank balances and smaller cohort sizes. Unfortunately, unlike A-Levels, the GCSE data do not include any value-added measures. These would allow us to take into account the prior ability of each pupil on entering secondary school, and their subsequent over- or under-attainment compared to similar children across the country. Instead we're left comparing apples with oranges.
All this leads me with the following rather unsatisfying conclusions:
In general, private schools do a lot better than state schools at in terms of raw GCSE attainment. Pick your metric of choice, but as a rule of thumb the difference seems to be roughly one grade per subject – which is very consistent with what we saw in the A-Level data.
However, private schools tend to have a more selective, affluent intake so ought to do better simply because of this. Unfortunately, since the publicly available GCSE attainment data for private schools is incomplete and no value-added measures are included, it's impossible to be sure what, if anything, they are achieving above and beyond their privileged starting points.
This is not just frustrating for data nerds like me (though it's certainly that). It also compromises the DfE's wonderful open-data work. Moreover, it prevents private schools from making a proper case that they offer not just prestige but also value for money. Lastly and most importantly, it prevents parents from making fully informed choices for their children. For everyone's sake, let's hope this situation improves.
Finally, on a personal note, if you're also a parent waiting with bated breath on this, National Offer Day, then good luck. May that email from your local authority bring the news you wish for.
Footnotes:
Given that IGCSEs have sometimes been denigrated for being less rigorous, or for being designed mainly with foreign students in mind, it may be tempting to assume that the most strongly academic private schools do not use them. But at least anecdotally that doesn't seem to be the case at all. Establishments missing from at least some of the data due to their use of IGCSEs famously include places you may have heard of such as Eton, Harrow, Marlborough and Westminster.
Note that despite their high proportions of SEN pupils, these schools have not been officially designated as special schools. All special schools, whether state or private, have been omitted from this analysis.
This figure is the average of 804 mainstream private schools in England for which we have information about day fees. Where the school quotes a range we have used the higher number as this usually indicates fees at the senior (ie, secondary) school, but it is possible that in some cases this overstates the normal secondary school fee.
The average of 416 mainstream private boarding schools in England for which we have information about boarding fees. As for day fees (see footnote 3), where a range is given we have taken the higher value to indicate senior school fees.
Every year around 600,000 children in England progress from primary to secondary school. Today marks an important milestone in that process as pupils and parents nervously await the outcome of 'National Offer Day' – when local authorities across the country reveal which schools have offered places to which children. It's often a confusing and stressful time for the families involved, especially when they have a strong preference of school, or when entrance exams are involved. (I speak from experience: one of my kids is in this year's cohort.)
Another difficult decision for a lucky few is whether to send their child to a state (aka 'maintained') school or fork out for a private ('independent') education instead. I had a mixed education, spending five years at a secondary comprehensive before going to do my A-Levels at a private boarding school. While there were a lot of differences between those two experiences, and I value both of them in different ways, I'm not sure that the academic side of my schooling was greatly affected one way or the other. So I was interested to see what data are available to help rationalise – perhaps even quantify – the differences between state and private schooling, at least in terms of national trends. This post kicks things off by looking at A-Levels, where the data are fuller and easier to interpret. A companion post examines the GCSE data, which are messier and less conclusive.
For A-Levels in particular, the differences were both greater and smaller than I had anticipated. But before I explain how and why, let's first set the scene.
Counting colleges
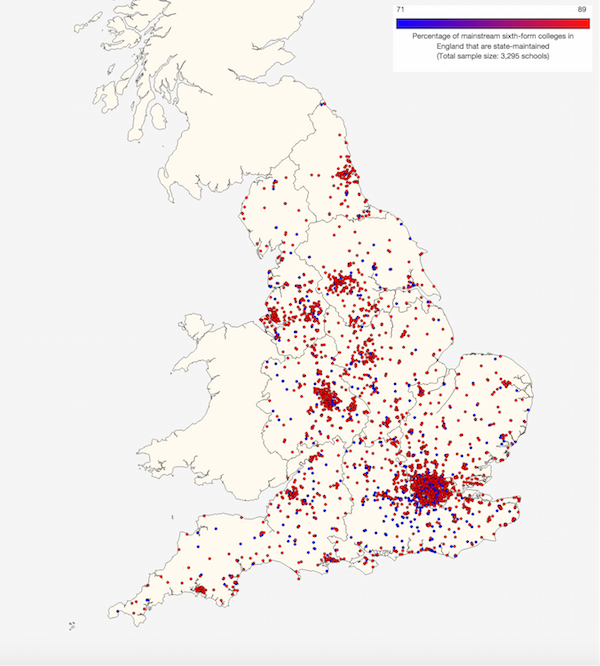
Using data from the Department for Education (DfE), I count 2,587 mainstream state sixth-form colleges in England, 86% of them associated with a secondary school but only 4% also associated with a primary school. By comparison, there are 708 mainstream private sixth-form colleges, all of them associated with a secondary school and 64% also associated with a primary school. Their locations are shown below in Map 1, which indicates state institutions in red and private ones in blue (click on the map to go to an interactive version):
Map 1: Locations of state (red) and private (blue) sixth-form colleges in England
Figure 1: Average numbers of students per college (2015)
Sample sizes: State colleges: 2,132-2,443. Private colleges: 565-698.
Sources: Department for Education; SchoolDash analysis.
As you can see, state establishments are on average more than twice as large as private ones in terms of total student numbers. But because private colleges are invariably associated with a secondary school, and often a primary school too, the difference in numbers becomes even greater when we look only at 16-to-18-year-olds or final-year sixth-form students; these show differences of more like 2.5- or 3-fold.
In contrast to private colleges, state sixth-forms cater for significant numbers of vocational and part-time students, so the gap narrows if we count only academic students and gets smaller still if we consider only full-time equivalent academic students. But whichever way you look at it, and whether you consider this a blessing or a curse, state colleges are on average a lot bigger than private ones.
Sample sizes: State colleges: 2,132-2,443. Private colleges: 565-698.
Sources: Department for Education; SchoolDash analysis.
Given the large gaps in average student numbers, these distributions may not look as different as you expected. That's in part because the large average values for state colleges are affected by a small number of huge institutions with many hundreds or even thousands of students (ie, way off the right-hand side of Figure 2, which as been truncated to make it legible). So it's important to understand that attending a state college doesn't necessarily mean a larger cohort size, though that often will be the case. Another important consequence of these differences is that although private colleges account for over 20% of sixth-form establishments in England, they cater for only about 8% of 16-to-18-year-olds.
Student profiles
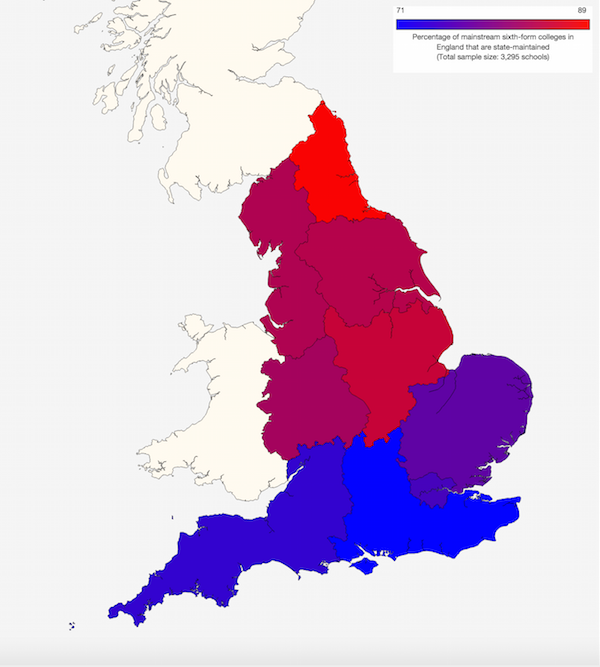
Next, let's look at what information is available about the kinds of students who attend state and private sixth-form colleges. Notwithstanding the availability of bursaries and scholarships, students at private colleges are not unreasonably assumed to be well-off. It is surely no statistical fluke than the lowest proportion of state colleges is in the affluent South East (71%) and the highest is in the poorer North East (88%), as shown in Map 2:
Map 2: Proportions of sixth-form colleges in each English region that are state funded
However, as a data nerd I would rather test this assumption of affluence – and ideally quantify it too – rather than simply take it for granted. Unfortunately there's no publicly available data that allows us to check this directly1. The best we can do is to assess the relative wealth or poverty of the postcodes at which these colleges are located. The Department for Communities and Local Government provides a metric known as the IDACI ('Income Deprivation Affecting Children Index'), which is a number between 0 and 1 that indicates the level of economic deprivation experienced by children in that local area. We have to take care in interpreting these data because we're using the location of the college rather than the home addresses of the students, who, particularly at sixth form, may live miles away. But with that proviso, they do indeed seem to confirm that state colleges tend to be located in less wealthy areas (mean IDACI score of 0.182) than private colleges (mean IDACI score of 0.126). Figure 3 shows the distributions of these scores for each college type. Generally speaking, the higher the deprivation level the lower the ratio of private-to-state colleges:
Figure 3: Deprivation index of school postcodes (2015)
Sample sizes: State colleges: 2,582. Private colleges: 707.
Sources: Department for Education; SchoolDash analysis.
Another important measure that usually correlates with overall academic attainment is the proportion of students with special educational needs (SEN). Here the figures look more evenly balanced, with an average of 12% of students in both groups receiving SEN support and about 2% having a 'SEN statement' or 'EHC plan' (which indicate a higher level of need – for an explanation see here). If anything, private colleges seem to have a slightly higher proportion of students with SEN statements: 2.2% versus 1.8% in state colleges. But this is rather misleading because the private college number is driven up by a few establishments with very small numbers of students and high SEN percentage scores2.
As you can see in Figure 4, most private colleges have lower proportions of students receiving SEN support or with a SEN statement / EHC plan, though even in state colleges such students generally represent a small minority.
Figure 4: Students with special educational needs (2015)
Sample sizes: State colleges: 2,128-2,198. Private colleges: 634-696.
Sources: Department for Education; SchoolDash analysis.
The overall sex balance of state and private colleges varies, but only slightly. The available data don't distinguish by year group, only chronological age, but I estimate that about 52% of students at state sixth-form colleges are boys, while the corresponding figure for private colleges is about 55%.
Finally in our consideration of student characteristics, it's also well worth considering what degree of academic selection colleges use in determining their intake. Of the 2,586 state sixth-form colleges in England, 165 are selective (ie, grammar schools), 2,330 are non-selective and 91 have an unknown status in the DfE data. So of the state colleges we know about, 7% are selective. Among the 707 private sixth-form colleges we know the selection status of only 252, so we have to take care in extrapolating, but of those, 97 (39%) are selective, more than five times the proportion in the state sector. Even in the unlikely event that all of the private colleges with an unknown status turn out to be non-selective, 14% of private colleges would still be selective, which is twice the level among state colleges.
Money, money, money
Another obvious advantage enjoyed by private schools and colleges is that they have more cash. Of the 707 private sixth-form colleges in England, we have day fees information for 501, and the average of these is about £5,450 a term, or £16,350 a year3. (The corresponding annual figure for boarding, where available, is very nearly £30,000 a year, though those establishments obviously provide board and lodging as well as tuition.) As far as we're aware, there's no publicly available breakdown of sixth-form state funding by college. The average grant funding per pupil received by state schools in England that have a sixth form is about £5,850. But this overstates the amount of money they receive for their sixth-form activities as it usually includes funding for secondary-school pupils, which is more generous. The standard rate of funding per sixth-form student (see details here) is £4,000 in the first year and £3,300 in the second year, with an additional £480 for students who qualify as 'disadvantaged'. This provides a range that is somewhere between a fifth and a quarter of the average fees charged by private sixth-form colleges.
Making the grades
With all these advantages – fewer, more affluent and more carefully selected students, plus a lot more money – you might expect private colleges to get better exam results than state colleges. And you would be right. As shown in Figure 5, the proportion of students achieving three A-Levels at any grade from A* to E is 84.6% in private colleges but only 67.8% in state colleges, a difference of nearly 17 percentage points:
Figure 5: Proportions of students reaching selected A-Level standards (2015)
Sample sizes: State colleges: 2,170. Private colleges: 521.
Sources: Department for Education; SchoolDash analysis.
Even more striking are the proportions of students achieving at least grades AAB including two in a so-called 'facilitating' subject (basically the kinds of results needed to get into a top university – see here for details). The average in private colleges is 27.4% while the same figure for state colleges is just 9.1%. This is perhaps the single most useful metric in understanding the academic attraction of private colleges: if they provide a three-fold better chance of going to a really good university then surely they're worth all that money.
Scoring points
The 'three A-Levels' and 'AAB' metrics are what's know as threshold measures because each student either reaches the required level or doesn't; there's no information about how far above or below it they came. Such metrics are arguably a bit crude, as well as being susceptible to gaming (eg, by focusing on students who are close to the threshold at the expense of others). It's therefore also worth studying points scores, which award points based on A-Level grades – 300 points for an A*, 270 for an A and so on down to 150 for an E. (For a more detailed explanation see this document from the DfE.) These cover a wider range of attainment levels and are therefore arguably more nuanced.
Figure 6 shows the distributions of scores per A-Level. Though these overlap substantially they are nevertheless quite distinct– surprisingly so in my view. Private colleges achieve an average score per A-Level of 231 points (about half-way between a grade C and a grade B) compared to 204 points (just below a grade C) in state colleges:
Figure 6: Average A-Level point scores per entry (2015)
Sample sizes: State colleges: 2,180. Private colleges: 532.
Sources: Department for Education; SchoolDash analysis.
A similar pattern is apparent when we look at the distributions of grades by subject. These are shown in Figure 7 for the 14 most popular A-Level subjects. In the majority of them, 'A' is the most common grade at private colleges, while in all subjects except maths and general studies the peak for state colleges is positioned one grade lower. At AS, all subjects show a much higher peak at grade A for private colleges than they do for state colleges, and of course lower peaks at lower grades (note that no grade A* exists for AS). Use the dropdown menu in Figure 7 to view each qualification and subject:
Figure 7: Distributions of AS and A-Level grades by subject
Sample sizes: State colleges: 5,212-59,304 entries per A-Level subject; 7,815-80,032 entries per AS subject.
Private colleges: 898-14,632 entries per A-Level subject; 7,815-80,032 entries per AS subject.
Sources: Department for Education; SchoolDash analysis.
It's also worth noting that there are some interesting differences in subject choices. For example, modern languages seem much more popular at private colleges while Design and Technology attracts more students at state colleges. But I digress.
It's possible to look at the total points score per student too. This incorporates not only grades but also the number of subjects taken. Once again, private colleges come out best with an average of 833 points per student (roughly equivalent to three A-Levels at grade B plus one AS at grade C) compared to 723 points per student in state colleges (roughly three A-Levels at grade C plus one AS at grade D). Figure 8 shows these distributions:
Figure 8: Average total A-Level point scores per student (2015)
Sample sizes: State colleges: 2,180. Private colleges: 532.
Sources: Department for Education; SchoolDash analysis.
A question of value
The overall picture seems clear: private sixth-form colleges do better at exams than state-funded ones. Although there's considerable variation between institutions and across subjects, if we were to quantify the overall effect we can say that it equates to roughly a grade per student per subject. Yet if, as seems likely, private colleges start off with more able students then how much of their success is down to this fact rather than any particular ability to deliver a more effective education (ignoring for now the fact that they also spend a lot more money)?
Fortunately the DfE provides a value-added score, which takes into account each student's prior attainment and gauges how well they did compared to other similar students across the country. (A fuller description of the method is provided here.) This enables us to allow for the different starting points of students when they arrive at sixth-form. The results are shown in Figure 9. The numbers on the horizontal axis represent fractions of a grade per subject. So a score of +1 means that students at the college in question are achieving a whole grade higher in each subject than would be expected from their past performance, and a score of -1 means that they're getting a grade lower:
Figure 9: Average value-added per A-Level subject (2015)
Sample sizes: State colleges: 2,189. Private colleges: 539.
Sources: Department for Education; SchoolDash analysis.
Here, too, we see a noticeable difference between state colleges (which have a mean value-added of -0.061) and private colleges (which have a mean value-added of +0.064). Yet the thing that most strikes me about this, especially given the previous analyses, is the narrowness of the range. The whole horizontal axis covers a single grade's worth of difference and almost all values fall within ±0.3 of a grade of the mean. This suggests that the differences between state and private colleges are much more modest than the raw exam results would suggest (though the differences between individual colleges is certainly quite large in some cases). Another way to put it is that if you're the kind of student who might go to a private college then it's quite likely you would do well – though on average not quite as well – in the state sector too.
Contained within these numbers for all A-Levels are some interesting subject-to-subject variations. A selection of these is shown in Figure 10. With the exception of A-Level physics, where state colleges seem to come out very slightly ahead, private colleges add at least a bit more value in every subject shown4:
Figure 10: Average AS and A-Level value-added by subject (2015)
Sample sizes: State colleges: 256-1,842 for A-Level subjects; 89-1,775 for AS subjects.
Private colleges: 152-508 for A-Level subjects; 51-472 for AS subjects.
Sources: Department for Education; SchoolDash analysis.
In chemistry, maths and biology the differences are small, while in history and English Literature they are much greater, with geography and French somewhere in between. It's tempting to infer from this that private colleges have a particular comparative advantage in the humanities and a much smaller advantage in science, but I'd like to see at least one or two more years' worth of data before jumping to that conclusion.
Moreover, the same pattern isn't present at AS, where the subjects that show the smallest degree of variability are geography and history, with French, English Literature and chemistry displaying the most sizeable differences, while maths, physics and biology show intermediate effects. This all seems a bit random, and given the smallness of some of the sample sizes that may indeed be the case. Either way, it's worth reminding ourselves that even the largest gaps seen here amount to an average difference of just 0.2 of a grade.
Finally, we'll look at the distributions of these value-added scores, as shown in Figure 11. Here we see that state colleges come out top in A-Level physics because, although they include some underperforming establishments, this is more than compensated for by some other colleges that seem to be doing particularly well (and therefore might be worth studying). Private colleges, in contrast, tend to cluster more around the median. The distributions for chemistry are extremely similar, while those for maths, biology, geography and French are much the same too, though with slight excesses of underperforming state colleges. As expected given the larger differences in average value-added, the distributions for history and English Literature show the clearest separations, though still with a lot of overlap. (I won't comment on the AS distributions, but you can view these yourself using the dropdown menu in Figure 11.)
Figure 11: Distributions of AS and A-Level value-added by subject (2015)
Sample sizes: State colleges: 256-1,842 for A-Level subjects; 89-1,775 for AS subjects.
Private colleges: 152-508 for A-Level subjects; 51-472 for AS subjects.
Sources: Department for Education; SchoolDash analysis.
What to make of all this? The analyses presented here certainly illustrate that some sixth-form colleges, particularly state-funded ones, are underperforming relative to their peers when it comes to sheer academic performance. However, such an outcome is virtually inevitable with comparative measures such as value-added – for every overperformer there must, almost by definition, be an underperformer. Indeed, the more striking aspects to me are the relatively narrow ranges of most variations once prior attainment is taken into account, and the large degree of overlap typically seen between the performance of state colleges and those of private ones. This suggests that state/private status alone is not a strong indicator of likely educational effectiveness.
So are private colleges worth the money? That's a matter of opinion rather than analysis. Certainly, if you've got the funds then it may well be worth paying to avoid a college on the left-hand side of Figures 9 or 11 if the alternative is to go to one on the right-hand side instead. But in practice most choices will involve the mass of colleges that lie somewhere nearer the middle of those graphs, and here the value-for-money case for going private is less clear cut.
As a dad pondering such things, I've been led to the following three conclusions:
On the whole, private sixth-form colleges get much better results than state sixth-form colleges, but most of this difference seems to be accounted for by the higher prior attainment of their students (which, credit where credit's due, may be partly a result of the same school's secondary education).
Consistent with recent comments by the editor of The Good Schools Guide, quite a few state sixth-forms compete with, or even outperform, private ones, especially in terms of academic value-added. So picking a good college (of any kind) is far more important than simply choosing an expensive one and hoping for the best.
If you're thinking of forking out £30,000 or more for two years at a private college then consider carefully what you're getting for your money. Is there a state sixth-form that might deliver the same results? And what are the costs and benefits beyond the strictly academic? Private schools can offer a lot, it's true, but thirty grand also buys a lot of private tuition, theatre trips and journeys to go out and see the world.
It is possible to get pupil-level socioeconomic data by requesting extracts from the National Pupil Database. But this is an onerous process with no guarantee of success. In this analysis we are limiting ourselves to information sources that anyone can access and analyse for themselves.
Where the school quotes a range for day fees we have used the higher number as this usually indicates fees at the senior school (ie, secondary school and sixth-form), but it is possible that in some cases this overstates the average sixth-form fee.
Subjects selected for this analysis constitute the top eight in terms of school sample sizes. Other subjects were judged to have sample sizes too small to be of interest.
About
This is the SchoolDash blog, where we write about education, data geekery and other things that spark our interest.
Blue links take you to other parts of the page, or to other web pages. Red links control the figures to show you what we're talking about.