Examining academies – Part 2: Sponsor-led
12th April 2016 by Timo Hannay [link]
Update 12:00 BST 12th April 2016: In an earlier version of this blog post, Figures 4, 5 and 6 below were incorrectly labelled with "2010/11 academies" instead of "2010/12 academies". This has now been corrected.
The first post in this series on academies looked at secondary converter academies. These are (generally very good) secondary schools that have chosen to move outside local authority control and get their funding directly from the Department for Education. The conclusions were that the shift to academy status doesn't seem to have made much difference to the academic performance of those schools, either positively or negatively. In this post we're going to look at a very different group: sponsor-led academies. These are previously underperforming schools that have been required to become academies and relinquish local authority control in order to effect a turnaround under new management. This was actually the original basis of the academies programme when it began back in 2002 under the Labour government of that time; it was only under the subsequent coalition government of 2010-2015 that academy status became available to successful schools too.
There are currently 620 secondary sponsor-led academies in England either in existence or in preparation. Their locations are shown in Map 1. The redder the dot, the older the academy. You can click on the map to go to a larger interactive version:
Map 1: Locations of secondary sponsor-led academies in England
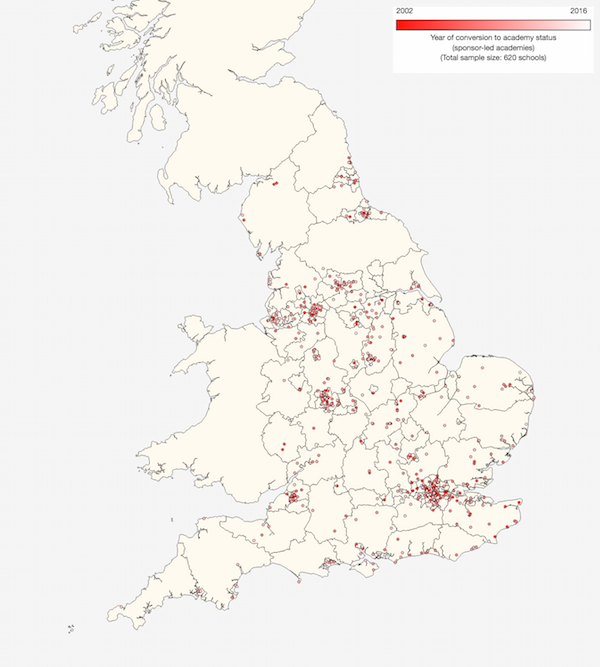
Many of the first sponsor-led academies were in London and other cities, and over 90% of all sponsor-led academies created to date are in urban locations.
Figure 1 shows the numbers of secondary schools that became – or will become – sponsor-led academies for each year since 2002, both on an incremental and a cumulative basis. (These total 616 rather than 620 because the latter number includes 4 proposed academies that do not yet have opening dates.)
As you can see, the numbers of new sponsor-led secondary academies climbed rapidly during the final years of the last Labour government (which ended in May 2010) and have since then generally held steady on an incremental basis at about 60-70 a year. Unsurprisingly, most of the schools that have converted, or are to convert, in 2016 are rated poorly by Ofsted (24 schools out of 28 that have a rating are either inadequate or require improvement). But for schools that were converted in earlier years, the proportion that remain poorly rated tends to decrease with time. For example, of the 36 schools that were converted in 2007, 28 are now good or outstanding:
Figure 1: Numbers of secondary sponsor-led academies and latest Ofsted ratings*
That all seems reasonably positive. But here at SchoolDash Towers we've never been the kind to take changing Ofsted ratings as a definitive mark of educational progress. So the rest of this post will attempt to more fully characterise, and where possible quantify, the changes that happen after schools become sponsor-led academies.
How long (has this been going on)?
In looking for performance improvements in schools that have become sponsor-led academies, it's important to know roughly how long it ought to take for the effects to show. If we look to soon after conversion then we might miss most or all of the change. On the other hand, if we look too long afterwards then less data will be available, especially for more recently opened academies, and there's a greater risk that other incidental changes might complicate the picture.
Figure 2 provides a rough answer to this question. It incorporates data (where available) for all sponsor-led academies created since 2002 and shows their average GCSE performance in the years before (negative numbers) and after (positive numbers) academy conversion. The performance measure used here is the GCSE value-added score. This is a relative measure – on the scale used below, the average for all schools in any given year is zero – so it has the benefit of not being subject to annual ebbs and flows in the same way that, for example, GCSE pass rates are. This enables us to pool together academies that were created in different years and still compare them on a reasonably consistent basis1. Note, however, that this doesn't eliminate all potential confounding factors. For example, the numbers for 6 and 7 years after conversion come mainly from academies that opened in 2006-9, under the Labour government. Those for 2 and 3 years before conversion come mainly from schools that switched in 2013-15, under the current Conservative government. Among other things, the political and administrative environment obviously changed a great deal between those periods, and no doubt the criteria for academy conversion were somewhat different too.
Figure 2: GCSE value-added measure in years before and after academy conversion
Nevertheless, it's interesting (and somewhat reassuring) to see in Figure 2 that schools do generally seem to improve following this intervention. We need to take care not to over-interpret these changes, which might be caused by other factors (including the statistical phenomenon known as regression to the mean). But on the face of it the changes appear both substantial and sustained. Some of the effect appears to be almost immediate and most of it occurs within the first 3 or 4 years following conversion, though eventually continuing for as much as 7 years, perhaps even longer. By 6 or 7 years following conversion, these previously underperforming schools seem, on average, to perform at roughly the national norm.
In order to strike a balance between (a) allowing enough time to elapse after conversion and (b) including a sufficient number of schools to provide a statistically useful sample, we're going to study those schools that became sponsor-led academies during the three years from 2010 to 2012. This gives us 188 schools with enough data to understand how they were doing at the time of their conversion (very little publicly available information is available for years prior to 2010) and also enough time to see some of the effects, if any (the most recent GCSE attainment data are from 2015). Among other things, this means that we're only looking at academies opened under the previous coalition government. Whether or how this might affect the results is not something we can determine from the available data, but it's worth bearing in mind when considering the analyses presented below.
As with our analysis of converter academies, we are going to compare the performance and progress of these sponsor-led '2010/12 academies' against three other groups:
- 'All schools': All mainstream state secondary schools in England. This isn't a particularly meaningful comparison, but at least provides a national benchmark for reference.
- 'LA schools': The subset of 'All schools' that remain under local authority control. Since we are interested in the effects of academy conversion, it makes sense to compare our schools with those that haven't gone through that process.
- 'Similar LA schools': A carefully selected subset of 'LA schools' that have similar pupil profiles to the '2010/12 academies'. Our academies will have pupils with particular (perhaps atypical) socioeconomic and academic characteristics, and we want as far as possible to compare them with similar schools in order to rule out such factors as the causes of any changes or differences in performance.
For more detail about exactly how that last group of 'Similar LA schools' is created, see the description given in the 'Taking a sample' section of the previous post about converter academies – the method used here is exactly the same. In this case, too, each academy is matched with the LA school that most closely resembles it in terms of pupil demographics, prior attainment and so on. Once again, some academies are matched with the same school, so while we have a set of 188 'Similar LA schools' to correspond to our set of 188 '2010/12 academies', we don't have 188 different schools. In this case we have 142 different schools, so each one is represented an average of 1.3 times. The vast majority appear just once or (sometimes) twice, but a few appear more often. Specifically, six schools appear 3 times, three appear 4 times, and one school (Thamesview School in Kent) appears 5 times. For a brief discussion of the pros and cons of this approach, please refer again to the relevant section of the previous post on converter academies, though note that the effect here is smaller.
Pupil profiles
Now we're ready to look at the characteristics of our different groups of schools. These are shown in Figure 3. It's clear that the 2010/12 sponsor-led academies contain substantially lower proportions of pupils with high prior attainment – and correspondingly higher proportions of those with medium and low prior attainment – than most other schools, whether under LA control or not. The proportions of previously high-, medium- and low-attaining pupils in 'similar' LA schools match much more closely. This is not surprising given that they were selected partly on this basis – but even these have slightly more high-attaining pupils and fewer low-attaining pupils. So while we have managed to correct for most of the difference we have not eliminated it altogether – something we should bear in mind later on when looking at their relative performance.
Figure 3: Pupil characteristics (2015*)
There is much less difference between the groups when we look at the proportions of pupils that have English as an additional language (EAL) or special educational needs (SEN), indicating that the 2010/12 academies are relatively typical on those measures. In contrast, the differences in economic deprivation, measured by eligibility for free school meals and the pupil premium, are large. Fortunately, the latter effects are well controlled for in the group of similar LA schools, which are very close to the 2010/12 academies on those measures. The same is broadly true for their ethnic mix (which, unlike the other measures included here, was not used as a basis for selecting the similar LA schools). The 2010/12 academies have slightly higher proportions of Asian pupils and slightly lower proportions of black pupils than the similar LA schools, but their proportions of white pupils are very close. Overall, any potential effects of ethnic differences seem to be reasonably well controlled for.
Observing outcomes
So much for the educational inputs, let's now study the outputs. Figure 4 summarises the 2015 GCSE performance of each school group on a variety of different measures of attainment and progress. On the standard measure of five good GCSEs including English and Maths, the 2010/12 sponsor-led academies substantially underperform compared to other schools across England, including all LA schools. But as we've already discussed, this is an unfair comparison because these academies start off with poorer, less able children. When we compare them with similar LA schools, they do almost (though not quite) as well on this measure. Indeed, for previously low-attaining pupils they seem to do quite a bit better, though the same is not true for medium- or high-attaining pupils. Perhaps consistent with this, they do ever-so-slightly better for disadvantaged pupils than for non-disadvantaged ones, though the differences here are so small that they may be just statistical noise.
Figure 4: GCSE results (2015)
Progress between ages 11 and 16 in English and Maths are also below national averages, but almost identical with those of similar LA schools. Consistent with the results we saw for overall GCSE performance, the 2010/12 academies do best for previously low-attaining pupils (see English and Maths) and deprived pupils (English / Maths). You can use the drop-down menu in Figure 4 to explore the other measures presented there.
Figure 5 makes the same comparisons using the GCSE value-added measure we previously saw in Figure 2. This tracks the progress made by each pupil from the end of Key Stage 2 (age 11) to GCSEs (age 16) and compares this against similarly able pupils across England. Those whose progress is in line with the national average get a value-added score of 1000, though in Figure 5 we have rebased this to zero in order to make overperformance (positive numbers) and underperformance (negative numbers) easier to see. To help calibrate your expectations, swings of tens of points above or below the median value are large. In 2015, a score below 919 (-81) would have put a school in the lowest 10% in the country, and any score above 1049 (+49) would have put it in the top 10%.
On this measure, among all pupils, the 2010/12 academies not only do worse than all LA schools, they also do slightly worse than similar LA schools. This is also true when we look just at high- or medium-attaining pupils, or at non-disadvantaged ones. However, once again the academies seem to do a bit better with low-attaining and disadvantaged pupils.
Figure 5: GCSE Value-Added Measure based on best 8 GCSEs (2015)
In constantly comparing the 2010/12 sponsor-led academies with similar LA schools we shouldn't lose sight of the fact that both of these groups of schools – catering for relatively large populations of disadvantaged and low-attaining pupils as they do – perform substantially below the levels of most other schools even on the value-added measure, which takes into account pupils' prior attainment and expected progress. This is really rather depressing, and arguably a more important current fact of life than the potential pros and cons of sponsor-led academies.
Still, sponsor-led academies are our topic here, and this is what we have found so far: academies that were opened in the period from 2010 to 2012 were, by 2015, performing comparably with LA-controlled schools that had similar intakes. That hardly sounds like a ringing endorsement of the academies programme. But recall that most of those academies started off as badly underperforming – some would say failing – schools. And if the timeline in Figure 2 is representative then many of them might still be continuing to improve. In order to understand the impact of the academy conversion on these schools it is essential to understand not only where they have got to, but also how much (or how little) they have improved.
Figure 6 shows changes in GCSE performance between 2012 and 2015. Don't pay too much attention to whether the changes for all school types are positive or negative as this almost certainly reflects changes in national assessment methods or standards. Focus instead on the relative performance of the 2010/12 sponsor-led academies, particularly compared to similar LA schools. Here we see that the amount of improvement shown by these schools, whether for overall GCSE performance or for progress in English or Maths, is always better than that of similar LA schools and often better than that of all other schools. Progress is typically more impressive for low-attaining and disadvantaged pupils than it is for medium-attaining, high-attaining or non-disadvantaged pupils. You can use the drop-down menu in Figure 6 to explore all of the data fields provided there:
Figure 6: Changes in GCSE results (2012-2015)
Once again, bear in mind that because we're only looking at differences between 2012 and 2015, we're almost certainly not capturing all of the changes that these academies have seen (or will see) since converting in 2010-2012. Even with this relatively narrow window, however, there only just over 100 academies and similar LA schools to compare because data for both years are available for only a subset of the 188 establishments in each group. This means that we're working close to the limit of what the available data can reveal, but the message they tell is a reasonably consistent one of steady improvement relative to LA-controlled schools with similar intakes.
Our conclusions for sponsor-led academies are therefore somewhat different to those for converter academies. Here, academy conversion does appear to result in improved performance, at least on average. So while it seems to have very little impact on the academic performance of successful secondary schools, it does seem to be an effective way to improve the performance of struggling ones.
What does this say about the government's desire that every school now covert to an academy? If anyone tries to convince you that it will make all schools better then you shouldn't believe them. But based on the evidence presented here – and obvious political frictions notwithstanding – it is also unlikely to do any of them much harm. The most likely positive effect is that it could help to close the gap between the best- and the worst-performing schools. But curiously, no one seems to be making that case.
Footnotes:
Acknowledgements: Thank you to several domain experts for providing comments on earlier drafts of this post – you know who you are. Any remaining errors or omissions are my responsibility alone.
Examining academies – Part 1: Converters
12th April 2016 by Timo Hannay [link]
The government's announcement that all schools in England are to become academies has brought a constantly simmering topic back to the boil, with teachers and local politicians, among others, resisting the move. The issue is clearly political and administrative as well as educational, but amid claim and counterclaim we decided to investigate what, if anything, publicly available data say about the performance of academies compared to other schools.
It is important to recognise from the outset that there are three major types of academy:
- Sponsored academies: Previously underperforming schools that have been required to convert to academy status and removed from local authority control with the aim of improving their performance.
- Converter academies: Schools that have voluntarily chosen to convert to academy status and become independent of local authority control.
- Free schools: New academies established outside local authority control by (for example) existing schools or teachers, parent groups, educational charities or religious organisations.
This post will examine only converter academies. A companion post looks at sponsor-led academies. In addition, both posts focus on mainstream secondary schools – not on primary schools, sixth-form colleges or special schools. We might cover some of those other groups (including free schools) in later posts.
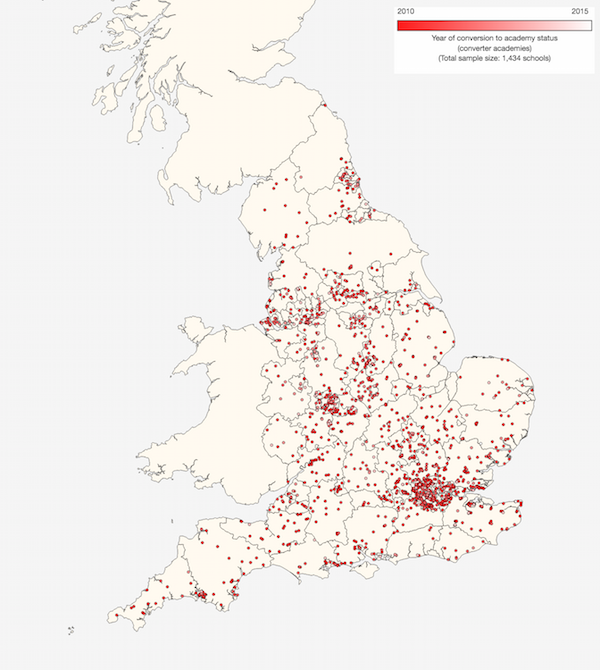
There are 1,434 secondary converter academies in England. Their locations are shown in Map 1. The redder the dot, the older the academy, with the first ones having converted in 2010. You can click on the map to go to a larger interactive version:
Map 1: Locations of secondary converter academies in England
Ten of those schools have since closed or merged with other schools, leaving 1,424 secondary converter academies that are still going in their previous form. These represent 42% of all mainstream state secondary schools in England. (A further 614 schools are sponsor-led academies, and 197 are free schools of various kinds, so altogether 65% of mainstream secondary schools in England are outside local authority control.)
Figure 1 shows that the vast majority of converter academies switched in the first three years of the programme, since when the rate of adoption has slowed to a trickle. The peak for incremental annual conversions occurred in 2011, when well over 700 mainstream secondary schools became academies, and by the end 2012 the cumulative total was already above 1,100 schools:
Figure 1: Numbers of secondary schools converted to academies and latest Ofsted ratings*
Figure 1 also shows that the overwhelming majority of converter academies are rated as 'Good' or 'Outstanding' by Ofsted. This is because it has been easier for such schools to to gain permission from the Department for Education, with the highest rated schools enjoying automatic approval and so making up the majority of early converts. (Note that the Ofsted ratings shown are the current ones, not necessarily those at the time of conversion, which aren't always available.)
The asymptotic reduction in the rate of academy conversions is presumably one of the reasons behind the government's latest drive to convert the rest. In addition, having two-thirds of state secondary schools in one system and the other third in another seems less than ideal from an administrative point of view. Hence, I suppose, the rather oxymoronic desire to 'impose autonomy'.
But what about the educational merits? These are, to say the least, controversial, but perhaps the data can provide some answers. Recently converted academies are too new and too few to provide any meaningful basis for comparison, but the cohort that converted in 2010 and 2011 have all had well over four years to show what they can do with their newfound freedoms, and there are 792 of them – more than enough to provide a statistically useful group.
Taking a sample
Rather than compare this cohort of early converter academies to all other mainstream secondary schools (some of which will have converted into academies since 2011), it's more meaningful to compare them with schools that haven't converted at all, so that's what we'll do here. For the same reason, we'll also omit free schools and other institutions that were founded outside local authority control. This leaves us with a comparator set of mainstream state secondary schools that remain under local authority control ('LA schools').
However, as we'll see, these two groups – 2010/11 converter academies and LA schools – are different in other ways, not just in their academy status. This is to be expected given the preference accorded to high-performing schools in the academy conversion process. To allow for this, we're also going to create a subset of LA schools that are in other ways as similar as possible to the group of 2010/11 converter academies ('similar LA schools'). This is the same approach we used in our previous analysis of single-sex schools. The next two paragraphs explain in more detail how this group of similar LA schools is created. If you're already familiar with this – or don't care – then please skip to the next section.
The process goes as follows. First we assemble the available DfE data for each academy, focusing in particular on pupil profile information. This covers areas such as prior attainment (eg, designated attainment bands and Key Stage 2 average point scores), economic deprivation (eg, eligibility for free school meals and the pupil premium), special educational needs (eg, SEN statements and provision of School Action Plus), and the proportion of pupils for whom English is an additional language (EAL). Then we scan all LA schools and identify the one that best matches this academy across all these different measures. We do this by calculating an aggregate difference score for each school and choosing the one with the lowest value. In addition, we make sure that academies which select pupils on the basis of academic ability are only paired with schools that do the same (and conversely for non-selective academies). This allows us to account for that fact that grammar schools are over-represented among converter academies, with 140 out of 163 (86%) having converted to date. Finally, we ensure that any single-sex academies are paired with other boys-only or girls-only schools, as appropriate. Note that we do not match academies with schools based on any outcomes criteria such as GCSE performance because these are the very measures on which we are looking for differences between the two groups.
The end result is a list in which all 792 of the 2010/11 academies are paired with a similar-looking LA school. Note that some academies are paired with the same school, so the list of similar LA schools does not contain 792 different schools. In fact, it contains 453 different schools, so each LA school on the list is paired, on average, with 1.7 academies. In practice, the vast majority of schools appear just once or twice, and only 11 schools appear more than 5 times, though a few occur even more often. This is particularly true for selective single-sex LA schools because they represent such a small pool with which to match single-sex selective academies. As a result, four schools appear more than 10 times each: St Olave's and St Saviour's Grammar School (11 times), Dartford Grammar School for Girls (13 times), The Judd School (16 times) and Tunbridge Wells Girls' Grammar School (17 times). The potential problem is that if these schools turn out to be unrepresentative then any statistical anomalies would be amplified by their multiple appearances. However, the alternative – pairing academies with patently dissimilar LA schools – is even worse. To be on the safe side, we ran the analysis twice, with the above four schools either included or excluded. The results were almost the same, so they will be included in all of the data presented here.
Compare and contrast
Before we look at their educational performance, let's first understand the kinds of pupils who attend these different types of school. Figure 2 shows that our group of 2010/11 converter academies (red bar) have greater proportions of pupils with high prior attainment than LA schools (dark blue bar) or indeed all mainstream state secondary schools (grey bar). As a result, they have correspondingly smaller proportions of pupils with medium and low prior attainment. This is important to recognise because it's not enough merely to find differences in academic attainment between different types of school, we also need to understand how much can be reasonably attributed to their academy status and how much is more likely to have been caused by other factors, such as pupils' prior ability.
Of course, this is why we created the additional group of 'similar LA schools' (light blue bar). Unsurprisingly – since we selected them partly on this basis – these show high, medium and low prior attainment profiles very similar to our group of academies. This will allow us to compare their performance with greater confidence and insight than if we simply compared these academies with all LA schools.
Figure 2: Pupil characteristics (2015*)
(Note that the vertical scale in Figure 2 adjusts itself automatically to make differences easy to see – be sure to look at the numbers in order to understand whether the bars represent large or small proportions of pupils. Note also that in this and later figures schools are only included in the '2010/11 academies' group if data for its twin in the 'similar LA schools' group is also available, and vice versa. This slightly alters the mean values in some cases, but allows us to be confident that we are comparing like with like when examining differences between these two groups.)
We can also see from Figure 2 that the 2010/11 academies have lower-than-normal proportions of pupils who are eligible for free school meals or the pupil premium, as well as those who have special educational needs or English as an additional language. But once again, the group of similar LA schools matches each of these attributes well, allowing us to discount them as likely sources of any large differences in outcomes.
Interestingly, the 2010/11 academies also have a distinctive ethnic profile. Specifically, they are less Asian and black, and correspondingly more white, than LA schools. Moreover, although the group of similar LA schools were not selected on the basis of pupil ethnicity, they look very similar to the academies in this regard too. How much, if any, effect this might have on educational performance is unclear (recent research suggests it might), but it is at least helpful to be able to rule it out as a potential complicating factor.
Academies in the 2010/11 cohort are somewhat larger than most LA schools, with an average of 1,130 pupils per school versus 920. In this regard, the 'similar' LA schools are actually a bit closer to other LA schools: they have an average of 990 pupils per school. The 2010/11 academies also tend to be slightly more southern than LA schools. Averaging all of the latitudes and longitudes of the acdemies brings you to location between Northampton and Banbury. The average location of LA schools is between between Leicester and Coventry while that of similar LA schools is roughly half-way between these two.
Converted?
Let's now look at academic attainment – specifically, GCSE results. Figure 3 shows average 2015 figures of each group of schools. 2010/11 converter academies did very well, with 68.1% of pupils gaining five good GCSEs compared to just 55.7% of pupils in LA schools. However, in 'similar LA schools' 66.1% of pupils reached the same standard, indicating that most – though not quite all – of the difference is caused by other factors, such as prior attainment and economic deprivation.
The picture gets more interesting when we look at specific pupil groups. In particular, academies seem to have very little effect on the performance of pupils with high or low prior attainment. There does, however, seem to be a difference for those with medium prior attainment. Sliced a different way, both disadvantaged and non-disadvantaged pupils appear to do slightly better in the academies than at LA schools, though the effects are small at best:
Figure 3: GCSE results (2015)
As well as GCSE attainment, we can also look progress made by pupils in the five years leading up to their GCSE exams. Here, too, academies do better than LA schools in both English and Maths, but comparison with similar LA schools suggests that most of this difference can be explained by other factors. In English, academy status seems to have more of an effect on previously low- and medium-attaining pupils than on high-attaining ones, and the same is true for low-, medium- and high-attaining pupils in Maths. (The patterns for disadvantaged and non-disadvantaged pupils are more ambiguous here. Use the drop-down menu in Figure 3 to explore these and other data fields.)
The emerging picture, then, is that 2010/11 academies do seem to perform slightly better than LA schools, but most of this (roughly 80%) can be explained by other factors. Where there is an effect, it is generally more pronounced among previously medium- and low-attaining pupils than among high-attaining ones.
This impression is strengthened further when we look at GCSE value-added scores. These are calculated by looking at the performance of each pupil at age 11 and comparing this to their attainment at age 16 using their best eight GCSE results. (For more details, see this PDF guide from the DfE.) Pupils who achieve the same amount of progress as other similarly able children across the country are assigned a value-added score of 1000, with figures above or below this representing, respectively, below-average or above-average progress. The value-added score for a school is simply the average for all of the pupils in its GCSE cohort.
Figure 4 shows average value-added scores for schools in each group, either above (positive numbers) or below (negative numbers) the national average of 1000. In this context, variations of 10 or 20 points either way might seem insignificant, but in practice no schools have value-added scores anywhere near zero. In 2015, for example, any score below 919 (-81) would put a school in the lowest 10% in England, and any score above 1049 (+49) would put it in the top 10%. So the kinds of variations shown here, which represent sizeable groups of schools, are certainly material.
Figure 4: GCSE Value-Added Measure based on best 8 GCSEs (2015)
Once again we see that in terms of overall GCSE performance the 2010/11 converter academies do better than LA schools (+10.3 versus -2.5), though the performance of similar LA schools (+7.0) suggests that about 80% of this gap is explained by other factors1. However, this varies depending on pupils' prior attainment, with high-attainers showing much less of an effect than medium-attainers and (especially) low-attainers. There isn't such a clear difference in relative performance between disadvantaged and non-disadvantaged pupils (though the differences between these two groups across all types of school is stark and rather depressing).
Self-improving or self-selecting?
A constant refrain among data analysts is that correlation is not causation. Even if (as seems to be the case) converter academies do a bit better on certain measures, this doesn't necessarily mean that their conversion into academies caused this to happen. It seems just as likely that already high-performing schools had the capacity and confidence to make the switch while others didn't. There's no definitive way to disentangle these different potential effects, but one way to gain an insight is to compare not just their current levels of performance but also the change in their performance over the last few years. If academy status itself has advantages then 2010/11 converter acdemies might be expected, on average, to have got better faster than LA schools.
Figure 5 shows the same GCSE metrics we saw in Figure 3, but for the whole period between 2012 and 2015, so we can see how the performance of different groups of schools changed over time. (Ideally we would have liked to have started in 2011, but most of the data doesn't go back that far. Those measures that are available for 2011 show very similar patterns, so I don't think this affects the results very much.)
One of the most striking things about this graph is the fact that all school groups show more or less the same patterns of ups and downs for every measure, whether in GCSE attainment, progress in English or progress in Maths. The same is true for measures that have gone up (such as progress in English by low-attaining pupils) as well as those that have gone down (such as progress in Maths by high-attaining pupils). This suggests that the biggest drivers of year-to-year variations are national effects (such changes to curricula or assessment standards). You can use the drop-down menu in Figure 5 to explore each measure, and click on the legend at the top to turn individual lines on or off:
Figure 5: GCSE results (2012-2015)
(Note that Figure 5 automatically shifts its y-axis up or down depending on which data set you are viewing. This is to make the differences visible while also allowing every data set to fit on the same graph. However, the range of the y-axis is fixed at 30 percentage points, so similarly sized gaps always represent similar percentage point differences whichever data set is being displayed.)
Recall that what we really want to know is whether 2010/11 academy converters got better faster than other schools, particularly similar LA schools. But whether we look at GCSE attainment, progress in English or progress in Maths there's scant evidence for this. Interestingly, the gap in English and Maths progress by low-attaining students actually seems to have closed.
Figure 6 makes it easier to see the changes in performance between 2012 and 2015. In this case we've also taken the additional precaution of including only those schools for which both 2012 and 2015 data are available, thus ensuring that we're comparing like with like. On almost every measure the 2010/11 academies have improved more (or fallen back less) than the group of all LA schools. The only exceptions are progress in English and Maths by low-attaining pupils. However, when we compare these academies with similar LA schools, their performance is mixed. Sometimes they come out ahead (eg, here, here and here) and other times they come out behind (eg, here, here and here). In general, though, their change in performance is comparable to that of similar LA schools, indicating that academy status in itself hasn't had much effect – either positive or negative – on their relative performance. You can use the drop-down menu in Figure 6 to explore the various different measures:
Figure 6: Changes in GCSE results (2012-2015)
It's also noteworthy that the measures on which the 2010/11 academies have shown most relative improvement tend to concern high-attaining pupils, while those on which they slipped back, relatively speaking, often involve low-attaining pupils. So even though we saw previously (in Figure 3 and Figure 4) that these academies as a whole serve low-attaining pupils well, this appears to have been a characteristic of those schools before they became academies. If anything, they have regressed slightly on those measures since becoming academies, at least in relative terms. (Another more positive way of interpreting this trend is that schools – especially LA schools – which were weaker at supporting low-attaining pupils have learned from those that are stronger, thus closing the gap. Either view is consistent with the data.)
Finally, let's look at how value-added has changed over time. Figure 7 shows value-added scores between 2012 and 2015 for each group of schools. On almost every measure the 2010/11 academies show more progress than the group of all LA schools but less progress than the group of similar LA schools. Once again, you can use the drop-down menu to view each data field:
Figure 7: GCSE Value-Added Measure based on best 8 GCSEs (2012-2015)
(Note that in 2014 there was a change in the way that the value-added measure is calculated. This is probably the main source of the kinks in some of the lines coinciding with that year.)
Figure 8 shows changes in value-added scores between 2012 and 2015. (As for Figure 6, it includes only schools for which both 2012 and 2015 data are available.) Again, the 2010/11 converter academies have made better progress than the group of all LA schools on almost every measure (the exception being the one concerning low-attaining pupils, where the difference is very small). However, they have made less progress than the group of similar LA schools. You can use the drop-down menu to view the various fields:
Figure 8: Changes in GCSE Value-Added Measure (2012-2015)
Personally, I wouldn't read too much into the finding that 2010/11 converter academies seem to have progressed a bit less over the last few years than similar LA schools. They started off somewhat better and it's usually easier for the second-best to catch up than for the very best to improve further. So to my mind there's little evidence that academy status has been a bad thing for these schools in terms of their academic performance.
However, neither does it seem to have been an especially good thing. The 2010/11 cohort of converter academies are generally good schools, and appear to serve low-attaining pupils especially well. But they were like that to begin with, and in some ways their particular strengths have reduced in relative terms. In this case at least, good schools became academies rather than academies becoming good schools. None of this is to say that the academies programme has no merits for such establishments (they chose to participate after all), only that obvious improvements in GCSE performance do not seem to be among them.
In the next post we will look at the other end of the academy spectrum: sponsor-led academies.
Footnotes:
Acknowledgements: Thank you to several domain experts for providing comments on earlier drafts of this post – you know who you are. Any remaining errors or omissions are my responsibility alone.