Poverty of opportunity?
2nd August 2016 by Timo Hannay [link]
Education is not just a vital cornerstone of our culture and economy, it is also potentially one of the great social levellers. However rich or poor our parents, however supportive or dysfunctional our families, a high-quality education ought to give each of us the opportunity to live a fulfilling life limited only by our own talents and efforts rather than by the circumstances of our birth. Or so the theory goes. In this post we look at the question of economic deprivation among children, and in particular how different types of schools either enable or hinder opportunities for those from poorer families.
Our main conclusions are:
- A substantial proportion of children in England live in relative poverty: it's not uncommon in particular areas for half or more of pupils to be eligible for free school meals.
- In general, more affluent families live closer to schools, but this varies a lot by school type. A family living next to a school rated 'Inadequate' by Ofsted is over 60% more likely to be poor than one living next to an 'Outstanding' school.
- Just as importantly, this well-known 'house price' effect is far from the only factor keeping poorer children out of good schools. Even those poorer children who do live close to a high-performing school are less likely to end up going there. Indeed, the data presented here suggest that school selection is an even bigger driver of social sorting than the locations of family homes.
- School types in which poorer pupils are under-represented after taking into account the level of poverty in their local areas include:
- Grammar schools and single-sex secondary schools
- Certain faith schools, particularly non-Christian faith schools and Roman Catholic schools
- Schools rated 'Outstanding' by Ofsted
- Secondary converter academies and primary free schools
The rest of this post looks at these trends in more detail. You may also be interested to see other related work such as the Sutton Trust's recent analysis of social selection in primary schools, Ofsted's 2013 report on underachievement among poor pupils, and the LSE's 2012 research into the effects of schools on house prices.
Patterns of poverty
The standard measure of deprivation in British education is eligibility for free school meals, which usually indicates a family in receipt of state benefits. As shown in Map 1, this measure varies greatly from place to place around the country:
Map 1: Proportion of pupils eligible for free school meals at any time during the past 6 years (2016)
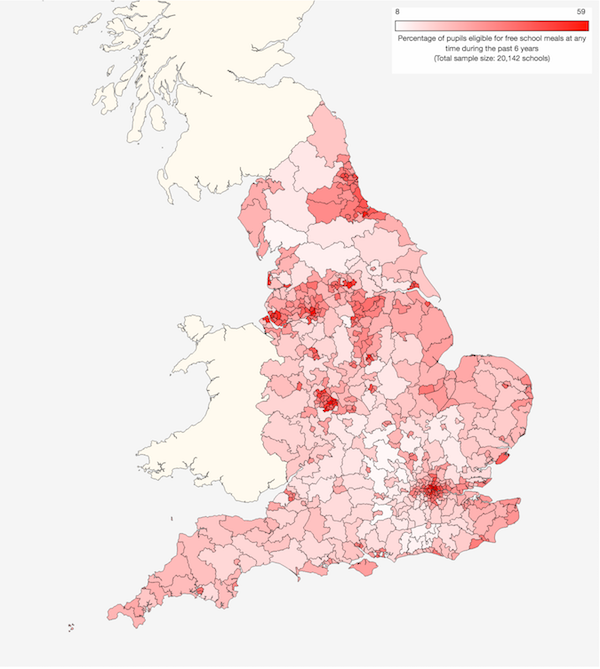
The highest concentrations of poor children in England are mainly in central London and other urban centres in the midlands and the north. Because these tend to cover small geographical areas it's easy to be misled into thinking that child poverty is relatively rare. But those places are also densely populated, so in some ways a more realistic picture is provided by the 'cartogram' shown in Map 2. This rescales each area according to the number of children who go to school there:
Map 2: Proportion of pupils eligible for free school meals at any time during the past 6 years (2016)
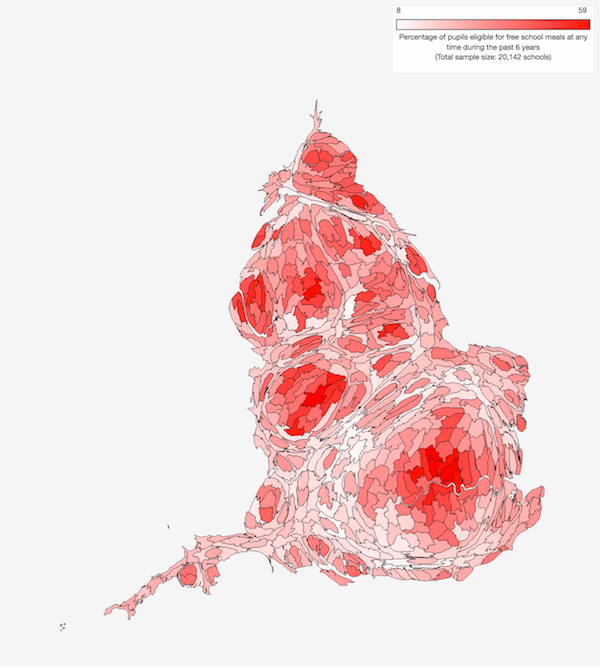
This makes it clearer that a substantial proportion of children in England live in relative poverty. It is not uncommon in particular areas for half or more of pupils to be eligible for free school meals. (Click on either of the maps above to go to a larger interactive version.)
Location, location, location
A commonly voiced concern regarding the education of poorer children is that it can be expensive to live close to a good school, resulting in socioeconomic sorting through house prices. The next few charts explore this phenomenon using a measure of child poverty called the 'Income Deprivation Affecting Children Index' or IDACI. This is a metric issued by the British government that shows the proportion of (school-age and pre-school) children who live in families with low incomes (see here for more details). Figure 1 shows how the average level of child deprivation varies by distance from all mainstream state primary and secondary schools in England:
Figure 1: Deprivation indices in the vicinities of schools (2016)
Consistent with the house price argument described above, child deprivation tends to go up as you move further away from a school (ie, more affluent families live closer to the school). The gradient is steeper for secondary schools than for primary schools, but this isn't because households near secondary schools are more affluent than those living close to primary schools. Rather, the vicinities around secondary schools tend to have higher deprivation than those around primary schools. I suspect that this arises from a combination of two factors: secondary schools require larger sites, which means that they are often situated in areas where demand for land is lower, but in neighbourhoods near the school this is counteracted by increased demand for houses within the catchment area.
Figure 1 also includes data for other measures of deprivation: among the elderly (using a metric called the IDAOPI), income deprivation (ie, households on low income) and employment deprivation (the involuntary unemployment rate). These all show similar patterns, albeit at different absolute levels and with a variety of gradients as you move further away from school. However, it is the IDACI that is most relevant here, so this is what we will use in the analysis that follows.
The differences seen in Figure 1 are relatively modest – the whole vertical axis spans only 4 percentage points. This is partly because we're looking at averages across all primary and secondary schools. Figure 2 shows the average IDACI score, but this time with schools grouped by Ofsted rating. This shows a much wider range of values:
Figure 2: Child deprivation in the vicinities of schools grouped by Ofsted rating (2016)
Unsurprisingly, primary schools rated 'Outstanding' by Ofsted (blue line) are generally in areas of lower deprivation, and families close to these schools tend to be more affluent than those further away. Also consistent with the conventional wisdom, schools rated 'Inadequate' (red line) are generally in areas of higher deprivation. What's perhaps more surprising is that in the latter case poorer families tend to live closer to school, with deprivation declining as you move further away. (One way to make sense of this is to consider that the further away you live from an underperforming school, the more likely you are to live close to a better one.) Schools rated 'Good' or 'Requires Improvement' show intermediate trends. Roughly the same pattern holds for both primary and secondary schools, though the differences are even more stark for the latter group.
Note that the vertical scale here has been expanded compared to Figure 1 and the differences are much more material. In particular, the level of deprivation in the immediate vicinity of the average 'Inadequate' secondary school is almost 10 percentage points higher than that of the average 'Outstanding' secondary school. This means that a family living next to an 'Inadequate' school is over 60% more likely to be poor than a family living next to an 'Outstanding' school1.
The next two graphs will use the same vertical scale as Figure 2 in order to make it easy to compare them. The first of these, Figure 3, shows schools grouped by their academy status using the following categories:
- Schools still under local authority (LA) control.
- Converter academies: good schools that have chosen to become academies.
- Free schools: new establishments than have been created as academies.
- Sponsor-led academies: previously underperforming schools that have been compulsorily converted to academies as part of a turnaround programme.
Figure 3: Child deprivation in the vicinities of schools grouped by academy status (2016)
Among primary schools, local-authority-controlled schools (blue line) and converter academies (green) and show very similar characteristics, with shallow upward deprivation gradients as you move further away from the school. Free schools (orange) tend to be located in poorer areas but there's little discernible change in poverty as you move away from the school – perhaps because these are new establishments, so property-price effects haven't had much time to arise. In contrast, sponsor-led academies (red) are located in areas of higher deprivation and this declines as you move further away from the school. The trend for sponsor-led academies is very similar to that for Ofsted 'Inadequate' schools, which is not surprising since there's a considerable overlap between these two groups.
Secondary schools show broadly similar patterns, though in this case converter academies and free schools tend to be located in areas with lower deprivation and the deprivation gradients around these schools are steeper. In addition, secondary free schools have a profile that more closely matches that of sponsor-led academies, with deprivation declining slightly as you move away from school.
Finally in this section, Figure 4 shows schools grouped by religious denomination. Among primary schools, C of E schools (green line) tend to be located in areas of low deprivation and on average there is a shallow upward gradient as we move away from school. Catholic primary schools (purple) have the opposite characteristics: they tend to be in areas of higher deprivation and there's a shallow downward gradient as you move away from the school. (This potentially puts Catholic primary schools in a good position to serve poorer pupils, something we shall return to later.) Looking at secondary schools, C of E and Catholic schools appear much more similar, both being located in areas that, on average, have slightly raised levels of deprivation. The main difference is that Catholic schools show an upward deprivation gradient as you move away from them, while C of E schools show no such gradient:
Figure 4: Child deprivation in the vicinities of schools grouped by religious denomination (2016)
Figure 4 also includes data for two other small groups of faith schools: other Christian schools (comprised of a variety of denominations, such as Methodist and Quaker, as well as schools of mixed or no particular Christian denomination) and other faith schools (a mixture of Jewish, Muslim, Hindu, Sikh and Buddhist schools). We're not going to discuss those here, but you can turn on the relevant lines by clicking on the legend above the graph – just bear in mind that the smaller sample sizes and greater diversity make these groups harder to interpret.
The school gate
So far so depressing: it does indeed seem more difficult for poor families to live close to desirable schools. But this isn't the whole story because, as many parents will attest, living close to a school isn't the same as being able to send your child there. So in this section we will look at how many poorer pupils make it into different types of school, and how this compares with the relative wealth or poverty of the neighbourhoods in which those schools are located.
One way of doing this is shown in Figure 5, which shows the proportion of pupils eligible for free school meals (FSM) plotted against the local poverty rate for children (IDACI) for all mainstream state secondary schools in England. There is a clear correlation between these two measures, though by no means a perfect one. The overall trend is shown by the grey diagonal line. This has a slope of about 0.75 (in others words, a 10 percentage point increase in the local IDACI results, on average, in a 7.5 percentage point increase in the proportion of FSM pupils). The reason the slope isn't exactly one is that, although FSM eligibility and the IDACI are both gauges of child deprivation, they have different definitions and therefore don't measure exactly the same thing.
Looking at Figure 5, we see that local-authority-controlled schools (blue) are roughly evenly distributed on either side of the diagonal line, indicating that while some schools have either more or fewer FSM pupils than we might expect given the levels of poverty in the their local areas, there's little if any overall bias. The same is true of free schools (orange). However, converter academies (green) seemingly fall more often below the line, indicating that as whole they accept fewer poor pupils than we might expect. Conversely, sponsor-led academies (red) tend to come above the line, which suggests that they take more than their fair share of poor pupils:
Figure 5: Proportion of FSM pupils against local deprivation index for secondary schools (2016)
(Click on the legend above Figure 5 to view any group or groups of schools; hover your mouse over each dot to see individual school details. You can also use the school profile pages in our Dashboards section to look up these figures for any mainstream state school in England – type the school name into the search box and then look in the 'Staff and Pupils' section of its page.)
Figure 6 shows the same information for primary schools. These show broadly similar patterns, at least for LA-controlled schools and sponsor-led academies. The overall trend (shown by the grey diagonal line) is also very similar, having a gradient of 0.76. However, in this case converter academies appear a bit more balanced and it is free schools that appear more likely to take less than their fair share of poor pupils:
Figure 6: Proportion of FSM pupils against local deprivation index for primary schools (2016)
In order to study these trends more systematically, it will be useful to have a single measure that captures for each school the relationship between the FSM measure the the local IDACI score. Our approach here will be simply to divide the first by the second, giving us a measure of the relative accessibility of each school to poorer children who live in its vicinity. It's tempting to call this something prosaic like the 'deprivation ratio' or obscurely technical like 'FSM/IDACI', but for the purposes of this post we will instead call it the 'Lazarus Index' (LI), inspired by the resonant, big-hearted poem The New Colossus, composed by Emma Lazarus and famously inscribed at the foot of the Statue of Liberty:
"Give me your tired, your poor,
Your huddled masses yearning to breathe free,
The wretched refuse of your teeming shore.
Send these, the homeless, tempest-tost to me,
I lift my lamp beside the golden door!"
Figure 7, below, shows the distribution of LI values for all mainstream state secondary and primary schools in England. The lower values on the left represent those schools that take fewer poor pupils than you would expect given the areas in which they are located, and the higher numbers on the right represent those that appear to take more than their fair share of poor pupils. As we've already seen, the average value is generally around 0.75-0.76, so any school with an LI around this value has a pupil population roughly in balance with its local community, at least in terms of deprivation.
One thing to bear in mind is that the LI value can be affected by the distance around each school used to calculate the average local IDACI. In general, deprivation reduces closer to schools, so a smaller radius will give a lower value for local deprivation and a higher LI. You can see this slight rightward shift in Figure 7 if we reduce the radius around secondary schools from 5km to 1km, and similarly for primary schools using a radius of 5km or 1km. What radius to use in our analysis? By our calculations, the median distance between each primary school in England and its nearest neighbour is 0.7km and the mean is 1.2km. For secondary schools the median and mean distances are 1.4km and 2.3km, respectively. Given that catchment areas inevitably overlap (not all schools are suitable for all children and there's usually a degree of choice), we guesstimate that radius values of 2km for primary schools and 4km for secondary schools are about right. These don't necessarily represent catchment areas, but rather the local area that is in principle close enough to the school to be served by it. The values we've chosen are necessarily somewhat arbitrary so in Figures 7 and 8 you can explore other values using the drop-down menus provided. In practice, however, changing them doesn't affect the final results very much.
Figure 7: 'Lazarus Index' of schools grouped by Ofsted rating (2016)
With that, we will now use Figure 7 to look at the distributions of LI values for schools with different Ofsted ratings. Among secondary schools (using a local radius of 4km), those with a rating of 'Outstanding' are heavily skewed towards the left compared to the group of all schools, and those with a rating of Inadequate are way over to the right. Schools with ratings of Good or Requires improvement lie in-between. This is a very important insight. We've already seen (in Figure 2) that fewer poor pupils live in the vicinity of schools with higher Ofsted ratings. We now see that on top of this, fewer poor pupils get into such schools even taking into account the composition of their local communities. Conversely, more poor pupils live close to lower rated schools, but even allowing for this, such schools admit more than their fair share of poor children. In other words, socioeconomic segregation is happening not only as a result of housing cost effects but also (whether consciously or otherwise) as a result of school admissions and selection processes.
One obvious confounding factor is the existence of grammar schools, which select pupils based on academic attainment and typically have very low proportions of pupils who are eligible for free school meals. They also tend to have high Ofsted ratings. Whatever you think about grammar schools2, their form of pupil selection is at least transparent, so it would be helpful to know how much of the effect is down to them. Looking at 'Outstanding' schools and comparing secondary schools both with and without grammar schools, it's clear that they account for a large proportion of schools with very low LI values. But they don't explain all of the imbalance and have very little effect on the other Ofsted categories. (Use the drop-down menu and click on the figure legend to explore other combinations.) Furthermore, we see a similar skew among state primary schools (using a 2km radius), where formal academic selection is essentially absent. Here too 'Outstanding' schools tend to have lower LI values than those rated 'Good', 'Requires improvement' or 'Inadequate'.
Figure 8 shows the same data but this time schools are grouped by religious denomination. Among secondary schools, those with no religious affiliation show a similar distribution to the group of all schools (unsurprising since they make up the majority). Church of England schools also show little overall bias, but the graph for Catholic schools is shifted to the left, indicating that on the whole they admit fewer poor pupils than their locations would suggest (and filtering out grammar schools does little to change this). Among primary schools too, non-religious and C of E schools show little bias but Catholic schools once again display a paucity of poorer pupils. (Data for other Christian schools and other faith schools are also provided, but note again that the sample sizes for these are small, making the data harder to interpret.)
Figure 8: 'Lazarus Index' of schools grouped by religious denomination (2016)
The results presented so far have given us a qualitative sense that some groups of schools – eg, those rated highly by Ofsted and certain types of faith school – tend to take fewer then their fair share of poor pupils. To understand this effect better it would be useful to be able to quantify it in order to be able to compare the degree of bias seen among schools of different types. This is what we will do over the next few figures. Specifically, we will look at the proportions of schools in each group that have either unusually low LI values (ie, they take few poor pupils compared to the proportions living in their neighbourhoods) or unusually high LI values (ie, they take more than their fair share of poor pupils). The threshold for declaring any value to be 'unusually' high or low is inevitably somewhat arbitrary, but we're going to use the commonly employed statistical measure of one standard deviation (SD) above or below the national mean. For secondary schools the mean and range are 0.75±0.40 and for primary schools they are 0.76±0.54. In any particular group of schools we would expect to see a few lying beyond these bounds even if there's no overall bias (this, after all, is statistics). However, such extreme cases should be (a) relatively rare – perhaps 10-15% of schools on either side – and (b) roughly equally balanced so that their net effect is close to zero3.
Figure 9 shows the proportions of schools with unusually high (green) or low (red) LI values, categorised by their Ofsted ratings. Among secondary schools, we can clearly see the trend that was evident in Figure 7, with 'Outstanding' schools showing a substantial overall bias against poorer pupils and 'Inadequate' schools showing a bias in the opposite direction. (The values for all schools are shown in the bottom bar for comparison.) This is partly because grammar schools tend to have LI values and high Ofsted ratings. But even if we exclude grammar schools, a similar, if less extreme trend is evident. The same is true among primary schools:
Figure 9: Proportions of schools with unusually low and high proportions of poorer pupils, by Ofsted rating (2016)
Figure 10 shows the same analysis by academy type. Among secondary schools there is once again an obvious trend: converter academies as a whole take fewer poor pupils than their locations would predict, while local-authority-maintained schools and sponsor-led academies seem to take more than their fair share. Free schools show a more subtle pattern, with relatively large proportions having both very high and very low LI values, especially when we omit grammar schools from the analysis. This suggests a wider range of effectiveness in catering for poorer children, but may also be a result of the relatively small sample size for this group. Primary schools show a slightly different picture, with converter academies displaying a more modest imbalance and free schools, though small in number, showing the largest bias. Primary sponsor-led academies, like their secondary counterparts, show a very large bias in favour of poorer pupils.
Figure 10: Proportions of schools with unusually low and high proportions of poorer pupils, by academy type (2016)
Figure 11 shows the breakdown by religious affiliation. (Note the expanded horizontal scale compared to Figures 9 and 10.) As a whole, secondary faith schools tend to take less than their fair share of poorer pupils while non-religious schools take correspondingly more. However, there are also significant differences among the different types of religious school. Non-Christian faith schools show the largest bias, but the sample size is very small. 'Other Christian' schools (as you will recall, a mix of denominations, including Methodist and Quaker schools, as well as schools of mixed or no particular Christian denomination) show a wide spread of LI values, which may also be explained by the small sample size for this group. The only large group that also has a large bias is Roman Catholic schools, an effect that becomes even stronger when we omit grammar schools from the analysis. By comparison, Church of England schools display a relatively balanced intake. The pattern among primary schools is broadly similar:
Figure 11: Proportions of schools with unusually low and high proportions of poorer pupils, by faith (2016)
Finally, we will look at the effects of academic selection and single-sex education. With very few exceptions, these only apply in secondary schools, the data for which are shown in Figure 12. (We have expanded the horizontal axis even further to accomodate the wide range of values.)
Figure 12: Secondary schools with low/high proportions of poorer pupils, by selection policy and sex (2016)
Among all secondary schools, grammar schools show a huge bias against poorer pupils – almost all of them have unusually low LI values. Though not on quite the same scale, boys-only and girls-only schools show very large effects too – though note that these are reduced when we omit grammar schools because many of that group are single-sex. These trends inevitably leave non-selective and mixed-sex secondary schools admitting disproportionately larger numbers of poorer pupils.
With that, let's take stock of which types of schools tend to have smaller or larger numbers of poor pupils than in their local communities. Figure 13 shows a summary of all the secondary school types we've looked at so far, plus a few more besides. For each school type it shows the difference between (a) the percentage of schools with unusually high proportions of poorer pupils and (b) the percentage of schools with unusually low proportions of poorer pupils. A negative value indicates a bias against poorer pupils while a positive value indicates a bias in their favour:
Figure 13: Deprivation intake bias relative to local population by secondary school type (2016)
Among those with lower-than-expected proportions of poor pupils, selective, single-sex and faith schools predominate (though note again that 'non-Christian faith' schools and 'other Christian' schools have small sample sizes). So too do high-performing schools, represented by the Ofsted 'Outstanding' and converter academy groups. Of course, these categories aren't mutually exclusive and any given school might exist in two or more of them. Interestingly, large schools show a bias against poorer pupils while small schools show a bias in their favour. This may be in part because large schools are often more popular (hence their size), resulting in more competition during the admissions process.
Figure 14 shows the same information for primary schools:
Figure 14: Deprivation intake bias relative to local population by primary school type (2016)
As we saw previously, compared to secondary schools, primary free schools show much more bias against poorer pupils while converter academies show less bias. School size seems to make much less difference in primary schools than it does in secondary schools. Other trends are broadly consistent with secondary schools.
Assessing access
So far we've looked at two kinds of social sorting in schools: by home location (with poorer families tending to live further away from good schools) and by school admissions (with poorer children less likely to be admitted to a good school even if they live nearby). Figure 15 combines these two attributes into one diagram for secondary schools. The horizontal axis shows the average level of deprivation (as measured by the IDACI) in the area within a 4km radius of each school. This indicates the likelihood of poor children being able to live in the vicinity of the school. The vertical axis shows the average Lazarus Index (LI) for each school. This indicates the likelihood that poor children already living in the vicinity of each school will actually end up attending it. The big grey dot in the middle, which represents all mainstream state secondary schools in England, will serve as a reference point. Schools that are most accessible to poor children will appear in the top right; those that are located in wealthier areas but disproportionately serve poorer pupils will show up in the top left; those that are within reach of poorer pupils but tend to favour more affluent ones will appear in the bottom right; and those that are out of reach to poor pupils on both counts will appear in the bottom left. (Click again on any of the preceding links to turn each shaded area on or off.)
Figure 15: Access to disadvantaged pupils by secondary school type (2016*)
First let's look at a few obvious examples to check the data and our understanding of this chart. If we group schools by local deprivation (low, medium or high – hover your mouse over each dot to see its name) then we see three groups for which there are large differences in the accessibility of local areas to poor children, but very little average difference in the accessibility of each school to poor children who already live in the area. There's a similar pattern when we group schools by region, with the affluent South East on the left and poorer North East on the right. (London schools show an unusually high average LI, possibly because the large number of private schools take wealthier children out of the state system represented here.) The difference between urban, suburban and rural schools tells a similar story, with lower average poverty in rural areas but relatively little difference in the accessibility of schools to any poor children who live there. In order to explore the vertical axis, the most obvious case to look at is grammar schools. Sure enough, we see relatively little difference in the poverty or affluence of the surrounding areas around grammar schools compared to non-selective schools, but there's a larger difference in the mix of children who actually make it into these schools, with much lower proportions of of poorer pupils.
Now we come to the more surprising and concerning trends. Grouping schools by the level of deprivation among their pupils (high, medium or low), we don't see a horizontal line – which would imply that these differences are driven mostly by the poverty or affluence of their local areas. Rather, we see a diagonal line – which indicates that school selection is playing a significant role too. Indeed, when we compare schools at which deprivation is high with those at which it is low, the difference in their LI values (2.6 times) is greater than the difference in their IDACI values (1.7 times), suggesting that school admission plays a greater part than local deprivation in the uneven distribution of poorer pupils.
There is a similar trend when we group schools by their proportions of previously low-attaining pupils, implying that schools with few such children tend to be in wealthier neighbourhoods but also that, even when this is taken into account, they are harder for poor children to enter. And we see the same trend yet again when we arrange schools by academy status or Ofsted rating: sponsor-led academies and 'Inadequate' schools are not only disproportionately located in poorer areas but also likely to take more than their fair share of poorer local children. (As we've already seen, this is caused in part by grammar schools – most of which are converter academies with high Ofsted ratings – but these represent a small proportion of secondary schools and do not account for all of the effects seen.)
Finally, we'll look at sex and religion. Single-sex schools are disproportionately located in poorer areas, but tend to cater to more affluent pupils (in large part because many of them are also grammar schools). The same is true of certain faith schools, specifically those affiliated with Roman Catholicism and the small number associated with various non-Christian faiths. The only group of faith schools that is anywhere near making itself more accessible to poorer children is the relatively small collection of 'other Christian' schools. (You can explore these and other types of schools by clicking on the legend at the top of Figure 15 to turn individual groups on or off.)
Figure 16, below, shows the same information for primary schools. We see very similar patterns to those for secondary schools when grouping them by their proportions of disadvantaged pupils. Once again, the difference in the LI values of high-deprivation and low-deprivation schools (3.0 times) is greater than the difference in their IDACI values (2.0 times), indicating that in primary schools, too, school admissions are an even greater source of social sorting than house-price effects. The patterns for previously low-attaining pupils, for different Ofsted ratings and for faith schools are also similar to those for secondary schools:
Figure 16: Access to disadvantaged pupils by primary school type (2016*)
There are also a few differences compared to secondary schools. Primary academies, for example, show a distinct pattern because converter academies and free schools are rarer, and the latter tend to show more bias against poorer pupils than their secondary counterparts. In addition, as we saw in Figure 14, primary schools display very little variation in LI by school size, which is very different to the situation for secondary schools of different size shown in Figure 15. (You can explore other groups of schools by clicking on the legend at the top of Figure 16.)
Overall, however, the pictures for primary and secondary schools are very similar. Poor children seem to cluster in particular schools due to a combination of demographic and school selection effects – and if anything it is the latter that has the larger impact. The schools most available to them are sponsor-led academies or those with poor Ofsted ratings. When it comes to admitting poorer pupils, faith schools tend to be either neutral or negative.
It is important to note that when we talk of school selection it doesn't necessarily mean that anyone is deliberately conspiring to keep poorer children out. On the whole, it is more likely that these effects are unintended consequences of admissions policies that make sense in other ways4. It is also possible that families presented with a choice of school are self-segregating along socioeconomic lines, with working-class and middle-class families tending to make different choices. And to put things in perspective, none of this analysis includes private schools, which would presumably make even the most imbalanced groups of state schools look positively inclusive.
But that doesn't mean things ought to continue as they are. If one of the main purposes of education is to act as a social leveller then on the basis of the evidence reviewed here it is failing in important ways. There are no easy answers to this unfortunate situation – any solutions are almost bound to be practically complicated and politically fraught. But until something changes it's hard to see how poorer kids will get a fair chance when the schools that are most open to them are largely the kinds that no one else wants to attend.
Footnotes: