School Workforce Census: a review
8th July 2016 by Timo Hannay [link]
Over the last few years the Department of Education (DfE) has conducted an annual School Workforce Census to gather data about the teachers and other staff who work at state-funded schools in England. The latest set of figures, gathered in November 2015, was released last week, so we couldn't resist taking a look. The following are the most interesting results gleaned from our analysis of the school-level data. (See here for the DfE's own high-level summary.)
Staffing by numbers1
Figure 1 shows that primary schools having been growing staff numbers while secondary schools have been flat or declining. Among secondary schools, Ofsted2 'Outstanding' schools have actually grown slightly, but 'Inadequate' schools have shrunk significantly, suggesting that competition is having an effect. The difference between 'Outstanding' and 'Inadequate' primary schools is less marked but also present. (Use the drop-down menu in Figure 1 to explore other Ofsted ratings; click on the legend at the top to visualise the information in different ways.)
Figure 1: Number of school staff (2011-2015)
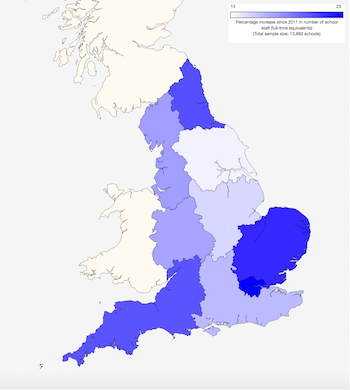
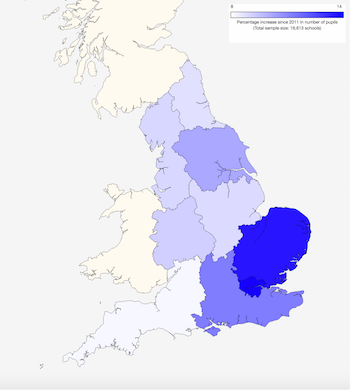
Among primary schools, all regions saw average increases in the numbers of staff3 (Map 1, below left) and pupils4 (Map 2, below right) between 2011 and 2015, with the overall growth rate of staff (17.6%) significantly higher than that of pupils (10.3%). London and the East of England showed the highest average increases in staff numbers, roughly mirroring the pattern of growth in pupils. However, the correspondence in other regions was weaker, with the North East seeing a higher relative increase in staff than in pupils, and Yorkshire and The Humber displaying the reverse trend. (Click on any of the maps that follow to go to a larger interactive version.)
Maps 1 and 2: Average percentage change in staff and pupils at primary schools (2011-2015)
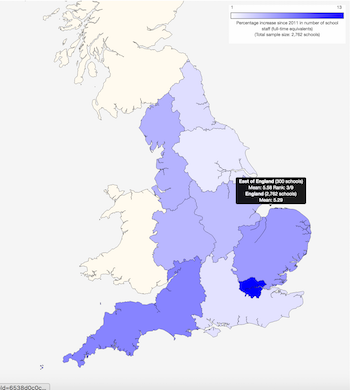
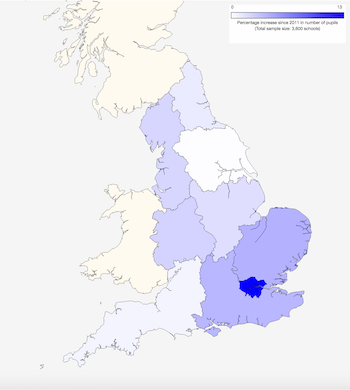
Among secondary schools, staff increases between 2011 and 2015 were strong in London but weaker elsewhere, especially Yorkshire and The Humber and the South East (Map 3, below left). Pupil numbers5 have also grown strongly in London but more modestly elsewhere and have been virtually flat in Yorkshire and The Humber (Map 4, below right). Nationally, staff numbers increased by an average of 5.3% while pupils numbers increased by only 3.8%. The South East was the only region to show lower growth in staff (2.3%) than in pupils (3.6%).
Maps 3 and 4: Average percentage change in staff and pupils at secondary schools (2011-2015)
Unsurprisingly therefore, the national pupil:teacher ratio has fallen in both primary and secondary schools. Among primary schools it went from an average of 20.7 in 2011 to 20.4 in 2015, while at secondary schools it fell from 15.9 to 15.2 over the same period, though in both cases there was a rise of 0.2 between 2014 and 2015. (It is important to note that the DfE's own commentary reports increases in pupil:teacher ratios between 2011 and 2015. For a discussion of this discrepancy see Footnote 6.) The ratio of teaching assistants to all teachers rose slightly in primary schools, from 0.68 in 2011 to 0.76 in 2015, but among secondary schools stayed virtually constant at 0.27.
Staff profiles
The School Workforce Census also includes data on the sex, age and ethnicity of staff. For teachers, there is information, too, about whether or not they are qualified and whether they work full-time or part-time. As shown in Figure 2, male staff are in the minority, especially the earlier phases of education. This applies not only to teachers but also to teaching assistants, support staff (secretarial and administration) and auxiliary staff (catering and maintenance). More surprisingly, non-white7 teachers, teaching assistants, support staff and auxiliary staff are also more common in secondary schools than in primary schools.
Figure 2: Staff characteristics by phase of education (2015)
In contrast to the situation among male and non-white teachers, those who work part-time tend to be more common in earlier phases of education. The same is true of qualified teachers, though these make up the vast majority at every phase.
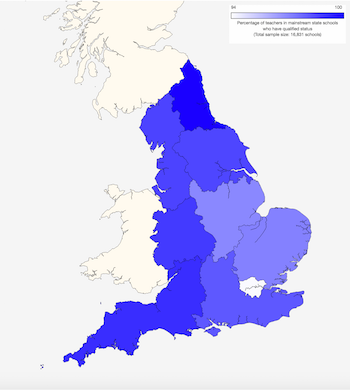
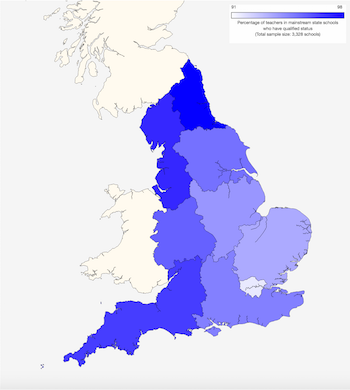
The proportions of qualified teachers nevertheless vary a bit across the country. In both primary schools (Map 5, below left) and secondary schools (Map 6, below right), the North East has the highest proportions (99% and 98%, respectively) while London has the lowest levels (94% and 92%). Click on either of the maps below to go to larger interactive versions.
Maps 5 and 6: Percentage of qualified teachers at primary and secondary schools (2015)
Comparing schools in urban, suburban and rural locations also reveals some interesting differences, as shown in Figure 3. Rural primary schools show much lower proportions of male staff of all kinds: teachers, teaching assistants, support staff and auxiliary staff than those in suburban or urban areas. Among secondary schools, there's no such trend for teachers or support staff, but there is for teaching assistants and auxiliary staff. (Bear in mind that the sample sizes for rural schools are small, making their numbers more susceptible to statistical fluctuations.) Rural schools also have much lower proportions of non-white teachers, teaching assistants, support staff and auxiliary staff, presumably reflecting the ethnic composition of their local populations. Teachers in rural schools also tend to be a bit older, are slightly more likely to be qualified and are quite a bit more likely to work part-time than those in urban schools.
Figure 3: Staff characteristics at urban, suburban and rural schools (2015)
There are differences by Ofsted rating too, as shown in Figure 4. On average, highly rated secondary schools tend to be more multi-ethnic, with higher proportions of non-white teachers, teaching assistants, support staff and auxiliary staff. (The pattern among primary schools is more ambiguous.) It's tempting to think that this may be because highly rated schools are more likely to be in urban areas, but we've checked and this isn't the case. Schools with more non-white teachers are more likely to have more non-white pupils, but the correlation is far from perfect. There are also slight tendencies for highly rated schools to have higher proportions of older, qualified and part-time teachers. Of course, this is not to say that any of these differences cause higher or lower performance, only that they are somewhat correlated. You can explore other trends using the drop-down menu in Figure 4.
Figure 4: Staff characteristics by Ofsted rating (2015)
Figure 5 shows a comparison of mixed and single-sex secondary schools. (There are very few state-funded single-sex primary schools so we have not analysed them here.) Taken as a whole, single-sex secondary schools have about the same proportion of male teachers as mixed schools do, but looking at boys' and girls' schools separately (light blue columns) we see that in each case there's a large bias towards teachers of the same sex. This also applies to teaching assistants and even (to a lesser degree) support and auxiliary staff. Single-sex schools are also more likely to employ non-white teachers, teaching assistants, support staff and auxiliary staff. (They also have many more non-white pupils: an average of 46% compared to 25% at mixed schools). In addition, their teachers are slightly more likely to be older. Girls' schools tend to employ more part-time teachers, perhaps because such a high proportion are women.
Figure 5: Staff characteristics at mixed and single-sex secondary schools (2015)
Figure 6 shows how teacher characteristics have changed over the last couple of years. (Earlier data exist but are not always consistent enough to make meaningful comparisons.) The proportions of male teachers have been static in secondary schools but gradually rising in primary schools, albeit from a much lower base. Non-white teachers have become more common, especially in secondary schools. (This broadly mirrors recent increases in the proportions of ethnic minority pupils, which rose among primary schools from 23.7% in 2013 to 25.0% in 2015, and among secondary schools from 24.8% to 27.5% over the same period.) Following a slight dip in 2014, the numbers of part-time teachers rebounded in 2015, especially at primary schools. Given the finding in Figure 4 that schools with high Ofsted ratings tend to have more part-time teachers, this is not necessarily a bad thing.
Figure 6: Changes in teacher characteristics (2013-2015)
In contrast to these rising trends, the proportions of qualified teachers have been declining in both primary and secondary schools, as have the proportions of teachers over 50. To some extent, this latter trend is presumably a consequence of the recent increase in teacher numbers that we saw in Figure 1 (because young teachers entering the profession are likely to outnumber older teachers entering the 'Over 50' age group). But it still means that the average experience level of teachers is falling, which is potentially a cause for concern.
In sickness and in health
Another interesting part of the School Workforce Census is the section on teacher sickness leave. In the 2014-2015 academic year the average primary school lost 68 days of teacher time due to sickness and the average secondary school (which is obviously much bigger) lost 333 days. As shown in Figure 7, The total number of days lost by primary schools has crept up slightly since 2011 while that for secondary schools has declined significantly over the same period. Given the fact that some schools are growing (not to mention the substantial average size differences between primary and secondary schools), it's perhaps more meaningful to look at the number of days lost per teacher. This measure actually shows a small decline among primary schools since 2011 (following an upward bump in 2013 and 2014) and confirms the downward trend at secondary schools. It also shows that secondary schools tend to lose slightly more time per teacher than primary schools do.
Figure 7: Teacher sickness leave (2011-2015)
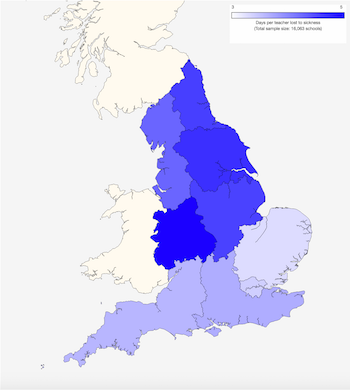
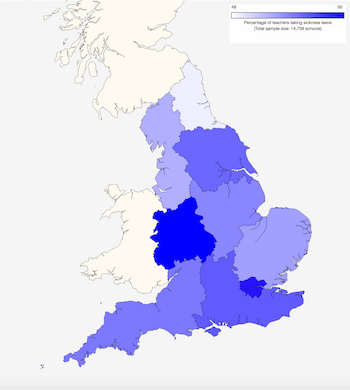
There are also interesting regional patterns. In terms of days lost at primary schools (Map 7, below left), the lowest levels are in the south and east, especially the East of England, with higher levels further north, especially in the West Midlands. The difference between the highest and lowest region is about 1.5 days per teacher per year. In terms of proportions of teachers taking sick leave (Map 8, below right), the lowest levels are in the North East. On this measure, too, the West Midlands show the highest levels, though London comes a close second. The difference between the North East and the West Midlands is 7.3 percentage points.
Maps 7 and 8: Days lost to sickness and percentage of teachers taking sick leave at primary schools (2015)
Among secondary schools, London loses the fewest days to teacher sickness (Map 9, below left), while the East Midlands, the West Midlands, Yorkshire and The Humber and the North East show the highest losses. The difference between the highest and lowest regions is about 1.6 days per teacher per year. In terms of the proportions of teachers taking sick leave (Map 10, below right), the North East once again shows the lowest levels, with the South West highest. The difference between the North East and the South West is 9.5 percentage points. (Click on any of these maps to go to larger interactive versions.)
Maps 9 and 10: Days lost to sickness and percentage of teachers taking sick leave at secondary schools (2015)
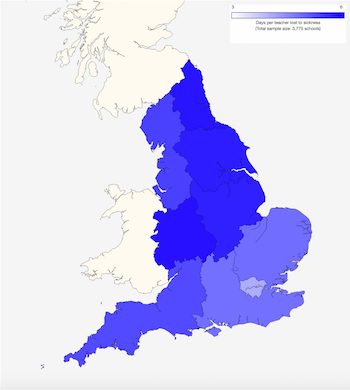
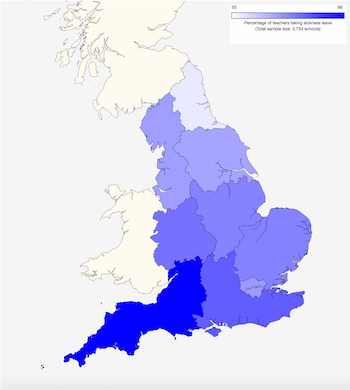
Figure 8 summarises staff sickness at primary schools for a variety of school types. The horizontal axis represents the average percentage of teachers who took any sickness leave in the 2014-2015 academic year, while the vertical axis represents the average number of days lost for each of them. The grey curves show the implied numbers of days lost per teacher across all teachers in a school. (For example, if 50% of teachers take sickness leave and average 8 days each then the average across all teachers will be 4 days.) The large grey dot represents all mainstream state primary schools in England. Looking first at the regional pattern (hover over each of the dots to see the region name and other information), we see that the West Midlands has both a high proportion of teachers taking sickness leave and a high average number of days for each of these teachers, resulting in the highest overall level of days lost to sickness. The East of England shows the lowest overall rates. As we saw in the maps above, the North East shows a curious combination: it has England's lowest proportion of teachers taking sickness leave but the highest average number of days for each of them, resulting in a relatively high overall absence rate.
Figure 8: Teacher sickness leave by primary school type (2015)
There is a very clear correlation between teacher sickness and Ofsted rating, with 'Outstanding' primary schools losing far fewer days than 'Inadequate' schools (the tiny dot at the top of the chart). Those rated 'Good' or 'Requires improvement' fall in between. The data don't tell us whether these higher levels of teacher absence are a cause or a consequence of the perceived lower performance at these schools, but you can imagine them feeding off one another: work at a struggling school must often be more stressful than at a high-performing one, and if the worst schools lose around 60% more staff days to sickness than the best ones then this surely makes them less likely to improve. The patterns for in-school deprivation, local deprivation and low prior pupil attainment are somewhat similar, if less stark. Also consistent with this, the pattern for academies shows low rates of sickness leave at converter academies (usually high-performing schools) and the highest at sponsor-led academies (often previously or currently low-performing schools). Local-authority-controlled schools show intermediate values while free schools (the tiny dot on the bottom-left of the chart) show a very low overall number of days lost, albeit based on a small sample size. Rural schools lose far fewer days than urban and suburban schools and large schools tend to lose more days than small schools because a higher proportion of their teachers take sick leave. Faith schools also show an interesting pattern, which I'll leave you to interpret – though note that some of the sample sizes are small so don't read too much into them. To explore further, click on the legend above Figure 8 to show or hide particular groups of schools.
Figure 9 shows the same information by local authority area, grouped and colour-coded by region. (Note that the scale has been expanded compared to the one used in Figure 8.) The most striking thing about this plot is the sheer range of values, with some areas losing as little as 2 days per teacher per year and others losing more than three times this amount. (Click on the legend at the top of Figure 9 to turn individual regions on or off; double-click to view a region on its own.)
Figure 9: Teacher sickness leave at primary schools by local authority area (2015)
Figure 10 shows similar data for secondary schools. In general, these lose more days to teacher sickness than primary schools do, and the variation between different types of schools is greater too. Among the regions, the East Midlands shows the highest number of days lost and London shows by far the lowest. The correlation with Ofsted rating is just as strong among secondary schools as among primary schools. In addition, grammar schools lose far fewer days than non-selective schools and single-sex schools – especially boys' schools – lose fewer than mixed-sex schools. The correlations for in-school deprivation and local deprivation are less clear-cut than for primary schools, as are those for urban and rural schools. Among academies, free schools once again display very low rates of absence (see the small blue dot in the far bottom-left of the chart). But unlike primary schools, secondary schools show very little difference between sponsor-led academies and local-authority-controlled schools. Faith schools show a noticeably different distribution too. (Click on the legend at the top of Figure 10 to see other groups or combinations of groups.)
Figure 10: Teacher sickness leave by secondary school type (2015)
Figure 11 shows secondary school data by local authority area (grouped and colour-coded by region). Here the range is even greater than it was for primary schools with some areas showing three, four or more times greater absence rates than others.
Figure 11: Teacher sickness leave at secondary schools by local authority area (2015)
Enquire within
Finally we'll look at how many teaching positions are either temporarily filled or unfilled. Overall rates are low – typically less than 1% – in part because the census is conducted in November, when schools tend to be fully staffed. Average teacher vacancy rates were 0.22% among both primary and secondary schools. This represents a slight increase for primary schools (from 0.19% in 2014) and a slight decrease for secondary schools (from 0.24%). The average proportions of temporary teaching positions down among primary schools (from 1.04% in 2014 to 0.90% in 2015) and also among secondary schools (from 0.77% to 0.73%).
Figure 12 shows the proportions of vacant or temporarily filled teaching postions at primary and secondary schools with different Ofsted ratings. There is a clear trend, with more highly rated schools generally having fewer teacher vacancies and fewer temporary teaching staff, presumably reflecting their greater ability to attract recruits.
Figure 12: Vacant and temporarily filled teaching positions (2015)
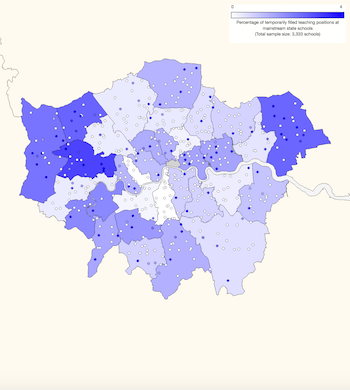
There are also regional differences in vacant and temporary teaching positions. For example, as shown in Map 11 (below left) London has the highest proportion of temporary secondary-school teachers (averaging about 1.0%) while the South West and West Midlands have the lowest proportions (0.5%). However, there is also considerable variation within each region, including London (Map 12, below right), and even between schools in each local area (dots in Map 12).
Maps 11 and 12: Percentage of temporarily filled teaching positions at secondary schools in England and London (2015)
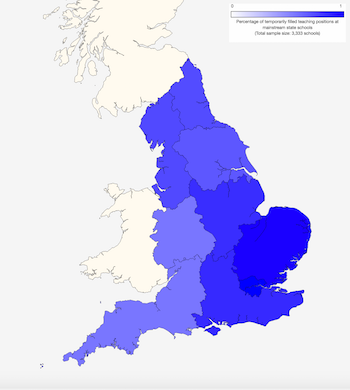
You can click on either map above to go to larger interactive versions. There are also separate maps showing the proportions of temporary teaching staff in primary schools as well as teacher vacancy rates in primary and secondary schools.
Summing up
A lot of interesting things come out of this, some heartening and others concerning. They include:
- Primary schools are growing while secondary schools are more or less flat overall, though the most successful secondary schools are continuing to get bigger.
- The proportions of qualified teachers and those over 50 are in slow but steady decline. More happily, so too is the number of days lost to teacher sickness.
- However, there are large variations in sickness leave by school type and geography. In general (and with notable exceptions), higher-performing and smaller schools located in wealthier or more rural areas lose fewer days.
- In addition, under-performing schools tend to have more teacher vacancies and temporary appointments.
So the glass is both half full and half empty: there are more teachers, but on average they are becoming less experienced. Good schools are growing, but struggling ones seem to be finding it harder to attract staff. And teachers are taking less sick leave, but in the very places that are most in need of attention, they are disproportionately more likely to be unwell and away.
Footnotes: