Examining academies – Part 3: Primary schools
4th May 2016 by Timo Hannay [link]
The first and second parts of this series looked at secondary schools that have switched to academy status, either as voluntary 'converter' academies or under the compulsory 'sponsor-led' academies programme. We concluded that schools in the former group, which were already academically strong, show little sign of having improved further following their conversion to academies. In contrast, the latter group, which were usually struggling before their switch, do seem to have benefitted, at least in terms of their exam performance. This post will use a similar approach to study the effect of academy conversion on primary schools.
The government's plan to compulsorily convert all English state schools to academies will have an especially large effect on the primary school sector. Unlike secondary schools, 65% of which are already academies of one kind or another (whether converter, sponsor-led or free schools), this applies to less than 20% of England's roughly 17,000 mainstream state primary schools. So over 80% will be forced to convert, often against their will.
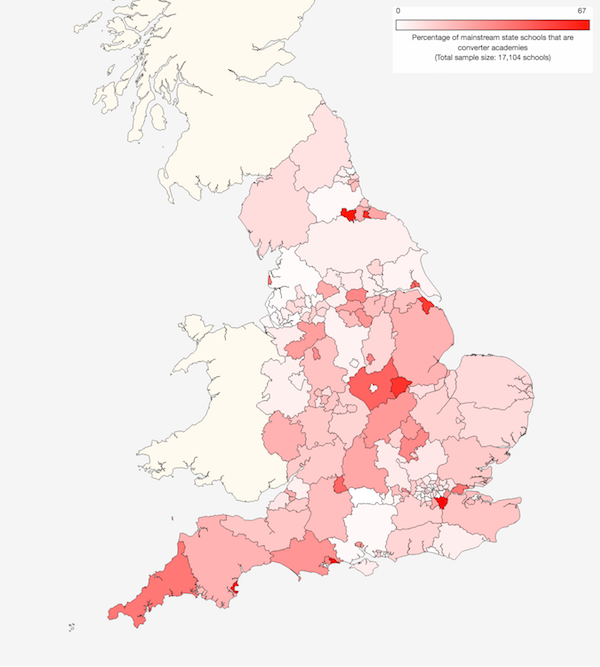
There are currently 2,145 converter academies that have voluntarily changed status since this programme began in 2010. As Map 1 shows, they are very unevenly distributed around the country, with hotspots in such otherwise disparate places as Bournemouth, Bromley, Darlington, Torbay, Middlesbrough and Rutland. All of these areas have seen over half of their primary schools voluntarily convert into academies. In contrast, a dozen local authority areas – from North Tyneside, Sefton and Warrington to West Berkshire, Camden and Brighton & Hove – have no primary converter academies at all. (Click on the map to go to a larger interactive version.)
Map 1: Proportion of mainstream primary schools that are converter academies
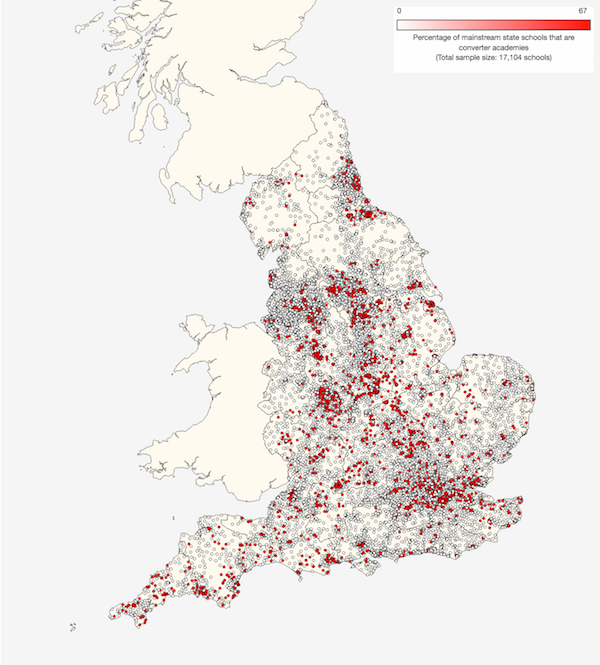
Map 2, which shows the locations of individual primary converter academies (red) and other primary schools (white), also gives a sense of how small a proportion of primary schools have voluntarily converted to date. These account for 2,145 of all 17,104 primary schools, or just under 13% of the total. (Again, you can click on the map to go to a larger interactive version.)
Map 2: Locations of mainstream primary converter academies
As we saw in a previous post, voluntary conversion of secondary schools into academies showed a huge spike in 2011 and 2012, followed by a rapid decline in conversion rates. In contrast, as shown in Figure 1, voluntary conversion of primary schools to academy status has been continuing at a more modest but consistent pace since 2011. On an incremental basis, over 300 schools – sometimes more than 400 schools – have converted each year, though with a slight downward trend since the peak in 2012. On a cumulative basis, as already mentioned above, there are now 2,145 primary converter academies in England:
Figure 1: Numbers of primary school converter academies and their latest Ofsted ratings*
As with secondary converter academies, these schools typically have very good Ofsted ratings at the time of conversion (of the 119 schools already converted or scheduled to convert in 2016, 100 of them, or 84%, are rated 'Good' or 'Outstanding'). This is because it has been easier for such schools to gain permission to convert. Note also that they tend to maintain these good ratings subsequently (over 91% of those that converted in 2011 are currently 'Good' or 'Outstanding').
Class of 2010-12
If we want to know what, if any, changes there have been in the academic performance of these primary schools following their conversion to academies then we need to select an appropriate group of schools to study. The latest attainment data is from 2015, so we will omit schools that converted in or after 2013 on the assumption that there has been too little time for them to demonstrate any measurable effects. We will concentrate instead on those schools that converted in 2010, 2011 and 2012, which gives us both a reasonable length of time to judge their progress and an acceptable sample size (807 schools) for analysis. Furthermore, we will omit three rather unusual single-sex state primary schools – The London Oratory School, Saint Ambrose College and Avonbourne College – because there are very few single-sex non-academy primary schools with which we can reasonably compare them. (These three schools are also rare in having integrated primary, secondary and sixth-form schools; primary and secondary schools usually exist as separate establishments.) The end result is a group of 804 mainstream state primary academies that converted between 2010 and 2012. To keep things simple we will refer to these the '2010/12 academies'.
Before we look at their performance, however, we need to understand the kinds of pupils who attend these schools, especially if (as seems likely) their characteristics differ from those of other primary school pupils. Figure 2 shows this data for all mainstream state primary schools in England ('All schools', grey), all such schools that remain under local authority control ('LA schools', dark blue) and our group of 2010/12 academies (red). (We will come on to the light blue column shortly.) As you can see, the 2010/12 academies are indeed very different from the LA schools. Specifically, they have greater average proportions of pupils with high attainment at Key Stage 1 (measured at age 7) and correspondingly smaller proportions of those with low KS1 attainment. They also have unusually low proportions of pupils who have English as an additional language (EAL), are eligible for free school meals or the pupil premium, or who have special education needs (SEN):
Figure 2: Pupil characteristics (2015*)
There are some other differences too. Academies tend to be larger than LA schools (with an average of 359 pupils compared to 276 for LA schools) and have roughly a third more more male teachers (comprising 19.1% of all teaching staff compared to 14.5% at LA schools). Make of that what you will.
The differences in pupil characteristics obviously present a problem if we want to compare the performance of these academies with LA schools because we wouldn't be comparing like with like. In an approach that will be familiar to anyone who has already seen our analysis of secondary academies, we therefore created a subset of LA schools that are as similar as possible to the 2010/12 academies in terms of their pupil profiles. We did this by matching each academy with the LA school that has the most similar pupil characteristics. In a few cases the same LA school is matched with more than one academy, but this is rare: a total of 763 LA schools were included, meaning that on average each was matched with 1.05 academies. (The vast majority of LA schools were matched only once, but 37 were matched twice and 2 were matched three times.) For a more detailed explanation and discussion of this approach, see our analysis of secondary academies.
As shown in Figure 2, pupils attending the group of 'Similar LA schools' (light blue) are much more like those at the 2010/12 academies. Compared to the group of all LA schools, they have more pupils with high KS1 attainment and fewer with low KS1 attainment, English as an additional language, eligibility for free school meals or the pupil premium, or with special educational needs. This gives us a more appropriate group for assessing the benefits (or otherwise) of academy conversion without other factors confounding the analysis. Nevertheless, we should bear in mind that the match still isn't perfect. In particular, similar LA schools have somewhat fewer high-attaining pupils and slightly more low-attaining pupils than the 2010/12 academies. They also have a different ethnic profile (unsurprising since we didn't select them on this basis), with slightly fewer Asian pupils and slightly more black or white pupils. We should bear in mind these small remaining differences when comparing the academic outcomes of these two groups.
It's also worth acknowledging that for the majority of primary schools, the level of pupil attainment at Key Stage 1 (KS1) is not strictly an input over which they have no control. This is because most schools accept children from 4 years old (or even younger) and the KS1 assessments aren't made until they reach 7. If any schools do a particularly good job at boosting attainment during those first few years then we might end up overestimating the prior ability of their pupils. However, in my experience KS1 attainment tends to correlate closely with socioeconomic factors such as financial deprivation, and where the link is broken this usually doesn't come about until the end of primary school (at 11 years old). This suggests that KS1 attainment is a reasonable proxy for prior attainment. In any case, we don't have much choice since no suitable metrics are available before the age of 7.
Academy attainment
Figure 3 compares the performance of our four school groups at the end of Key Stage 2 (ie, age 11). The average 2010/12 academy does slightly better than the average LA school at getting pupils to level 5, level 4B and level 4 (the national target) in all three of Reading, Writing and Maths. However, the same is true of the similar LA schools. In general, the gap between 2010/12 academies and similar LA schools is less than half of that between these academies and all LA schools. This suggests that most of the difference between LA schools and academies, which is relatively small to begin with, is due to their differing pupil characteristics rather than anything to do with the schools themselves. The picture also seems very consistent whether we look specifically at boys or girls, high- or low-attainers, or EAL pupils. The one area in which the academies seem to be outperforming slightly more is with disadvantaged pupils (see comparisons for Level 5, Level 4B and Level 4 attainment), but even here the gap is modest. (Use the drop-down menu in Figure 3 to explore other attainment levels and pupil categories.)
Figure 3: Key Stage 2 attainment (2015)
A similar pattern emerges when we look at individual subject areas, as shown in Figure 4. This summarises the proportions of pupils attaining different levels in exams and assessments that take place at the end of Key Stage 2 (ie, at age 11). In Reading, GPS (Grammar, Punctuation and Spelling) and Maths, pupils at 2010/12 academies do a bit better than those in LA schools. But the gap with similar LA schools, though present, is always narrower. The same is also true when we look at teacher-assessed attainment in Writing, English and Science. (You can click on the legend in Figure 4 to show or hide particular grades.)
Figure 4: Key Stage 2 results (2015)
Everything we've seen so far suggests that the 2010/12 academies perform a bit better than the average LA school, but that most – though not quite all – of the difference seems to be due to pupil characteristics rather than anything specific to the schools themselves.
That said, what interests us most is any change in the performance of these schools since they became academies. This is shown in Figure 5. Among pupils achieving Level 5 in Reading, Writing and Mathematics (roughly speaking, the top quarter by attainment), the 2010/12 academies have not only maintained their small advantage over similar LA schools, but appear to have grown it slightly. This applies roughly equally to both non-disadvantaged pupils and disadvantaged pupils (ie, those eligible for free school meals or the pupil premium). In general, gaps of a percentage point or less have grown to a couple of percentage points.
However, when we look at the bulk of pupils who achieve the national target of Level 4 in Reading, Writing and Mathematics, we see that the gap between the 2010/12 academies and similar LA schools has shrunk, both for non-disadvantaged pupils and (especially) for disadvantaged pupils. In the latter case a gap of more than 5 percentage points has shrunk to less than 1 percentage point.
(If it helps to make the graph clearer, you can click on the legend of Figure 5 to turn individual lines on or off. Also note that the y-axis automatically scrolls up or down to keep the lines in view, but the range is fixed so similarly sized gaps always represent similar numbers of percentage points.)
Figure 5: Key Stage 2 attainment (2012-2015)
It's worth bearing in mind that many of these differences between the average values for various groups of schools are rather small, and certainly smaller than the range of values within each group. But the story that seems to emerge is that, on average, the 2010/12 academies got a bit better at coaxing more out of the most able pupils, while any advantage they previously had in helping pupils to achieve the national target of Level 4 was all but eliminated. Overall, I'd declare that a score draw. In other words, the 2010/12 academies got neither better nor worse following their conversion, at least on these measures.
Figure 6 shows a similar time course for another measure of overall academic attainment, 'Key Stage 2 point score'. Once again we see the 2010/12 academies maintain their advantage over similar LA schools (and all LA schools), but the gap seems, if anything, to have shrunk since they converted:
Figure 6: Key Stage 2 Point Score
As with secondary schools, then, we conclude that primary converter academies do indeed seem to be good schools. But they were good before they became academies and there's very little evidence that conversion has done anything to improve – or indeed hinder – their average academic performance.
Sponsor-led academies
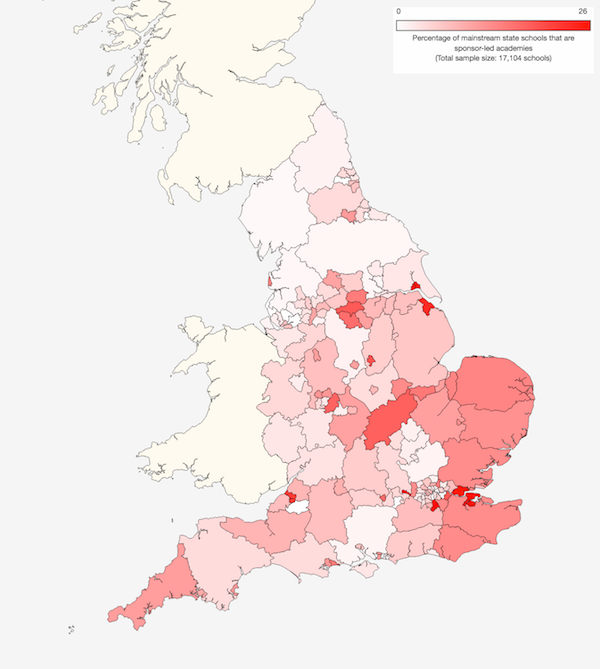
There is, of course, a whole separate class of primary academies in addition to the voluntary converter academies. These are the sponsor-led academies: schools that have been compulsorily removed from local authority control in order to tackle historic underperformance. Map 3 shows that, as for converter academies, the distribution of primary sponsor-led academies is patchy. There are hotspots in Croydon, Slough, Medway, Thurrock, Kingston-upon-Hull and North East Lincolnshire, all of which have seen over 20% of their primary schools turned into sponsor-led academies. In contrast, a dozen local authorities – from Gateshead to Greenwich – currently have no sponsor-led primary academies. (Click on the map to go to larger interactive version.)
Map 3: Proportion of mainstream primary schools that are sponsor-led academies
Although the sponsor-led academy programme was begun in 2002 (by the Labour government of that time), primary schools barely featured until 2012 (under the Conservative-Liberal Democrat coalition government). As shown in Figure 7, the number of primary schools being put through this programme suddenly jumped in 2012 from just handful each year to a range of 170-300 a year on an incremental basis. On a cumulative basis, there are now 1,062 primary sponsor-led academies in England either in existence or scheduled to be converted (plus a handful more with no specific conversion date yet assigned):
Figure 7: Numbers of primary school sponsor-led academies and their latest Ofsted ratings*
Figure 7 also shows that the most of the primary schools that become sponsor-led academies have poor Ofsted ratings: of the 80 schools already in the pipeline for 2016, 77 have Ofsted ratings and 90% of these are either 'Requires Improvement or 'Inadequate'. But the schools in question do appear to improve over time: of the 177 sponsor-led primary academies created in 2012, 56% currently have an Ofsted rating of 'Good' or 'Outstanding'.
This is reassuring, but it would be even better to be able to quantify the effects. To this end, we're going to study the 475 primary schools that became sponsor-led academies during 2012 and 2013 ('2012/13 academies'). Since the latest attainment data is from 2015, this gives us only a relatively short period of 2-3 years to gauge their progress, but very few primary schools were converted before that so if we want a reasonable sample size then we don't have much choice. We should bear in mind, however, that whatever changes we do see might not be the whole story. Our analysis of secondary sponsor-led academies suggested that improvements there took in the region of 4-7 years (perhaps even longer) to be fully realised and it's quite possible that primary schools show similar timescales.
Figure 8 shows the characters of pupils in the 2012/13 academies in comparison to:
- All mainstream state primary schools in England ('All schools')
- The subset of schools in group 1 that remain under local authority control ('LA schools')
- A subset of 425 schools from group 2 that are most similar in terms of pupil intake to the 2012/13 academies ('Similar LA schools'). See the analysis of converter academies above for more information about how these schools are selected.
As you can see, the 2012/13 academies have fewer pupils who showed high attainment at Key Stage 1 (ie, at 7 years old) and more who showed low attainment. They also have higher proportions of pupils for whom English is an additional language (EAL), those who are eligible for free school meals or the pupil premium, and those with special educational needs (SEN). In addition, they have more Asian and black pupils and fewer white ones. The group of similar LA schools generally matches these characteristics well (including ethnic mix, which was not among the criteria used for their selection), though even these schools have slightly more high-attaining pupils, and slightly fewer low-attaining pupils, than the 2012/13 academies. This is something we should keep in mind when interpreting the results.
Figure 8: Pupil characteristics (2015*)
Interestingly, even though these schools became academies by a completely different route to that followed by the converter academies we discussed above, and although they have very different pupil profiles too, they do share some characteristics with those other academies. In particular, they are larger than LA schools (with an average of 339 pupils per school compared to 276) and have more male teachers (comprising 20.4% of all teaching staff compared to 14.5% at LA schools). I don't know why this should be, but if you do then let us know.
How have the 2012/13 academies fared since converting? Figure 9 shows that they not only perform worse than most LA schools but also underperform compared to LA schools with similar intakes. However, this was the case before they became academies, so the more interesting finding is that they have narrowed the gap in the 2-3 years since they converted. This is apparent when looking at pupils achieving Level 5 in Reading, Writing and Maths, where the overall gap with similar LA schools roughly halved (from 3.6 percentage points in 2013 to 1.7 in 2015). The effect seems to have been a bit smaller for non-disadvantaged pupils than for disadvantaged ones.
Changes in the proportions of pupils achieving Level 4 (the national target) in Reading, Writing and Maths have been even more dramatic. There the gap fell by almost two-thirds (from 8.9 percentage points in 2013 to 3.1 in 2015). Once again, although improvements were seen for both non-disadvantaged and disadvantaged pupils, the latter showed a stronger effect:
Figure 9: Key Stage 2 attainment (2013-2015)
Figure 10 shows a similar analysis for Key Stage 2 point score. Again, we see a closing of the gap with LA schools, especially similar LA schools:
Figure 10: Key Stage 2 Point Score
It's important to recognise that these sponsor-led academies still, on average, underperform other schools, even those with similarly challenging intakes. However, they do appear to have become noticeably better in a relatively short time following academy conversion.
Overall, these results suggests a very similar – perhaps surprisingly similar – picture to the one we saw in secondary schools: when converted to academies, good schools generally stay good and bad schools generally get better. This raises questions for both sides in the current debate. The challenge for those who support universal compulsory academisation is to explain why a good school should be forced to covert against its wishes if there are unlikely to be any tangible academic gains. And the challenge for those who oppose it is to explain how else they would reduce the disparity between the best and the worst schools in the country, a gap that is still far too wide.
Acknowledgements: Sincere thanks to the various domain experts who provided comments on earlier drafts of this post. Any remaining errors or omissions are my responsibility alone.